Climate services for all
Interactive climate services illuminate different aspects of climate change
On the occasion of the EUMETSAT Climate Symposium “From Space to Climate Services: Co-creation in Action” in Darmstadt, Germany, we highlight three ways EUMETSAT data contribute to climate services.
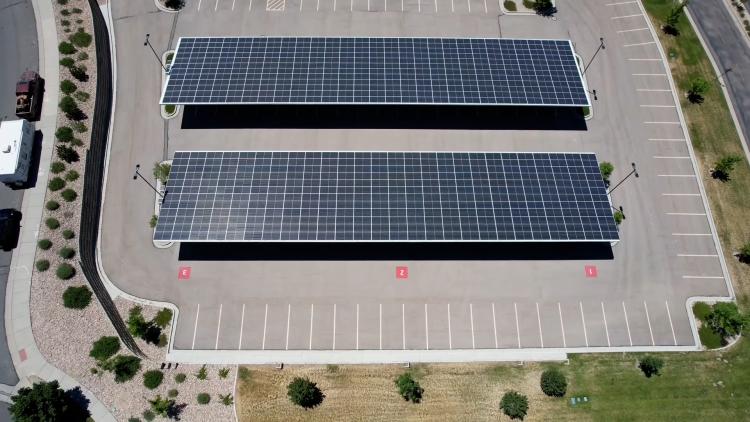
“If you want to install a photovoltaic system on your rooftop, you can use this service to get a very first estimate of what might be possible not only in terms of electricity or heat production but also in terms of government financing,” said Tetzlaff, senior satellite expert at MeteoSwiss and EUMETSAT's Satellite Application Facility for Climate Monitoring. “This service provides you with an estimate of what the government might pay for your photovoltaic system and how much time it might take to pay off the cost of the system.”
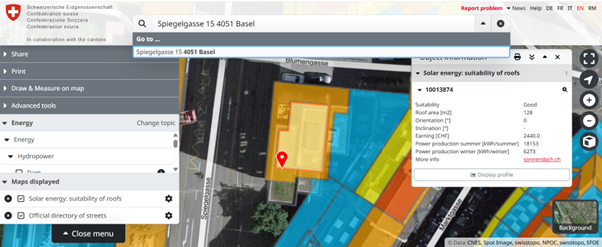
Credit: Swiss Federal Office of Energy
For example, according to the Sonnendach service, the roof of the Environmental and Protection Agency in Basel, Switzerland, is highly suitable for producing solar energy. Sonnendach indicates that if the full surface of the roof were covered in photovoltaic panels, those panels would generate electrical power that could be used to produce 24,400 kilowatt hours of electricity per year, nearly seven times the electricity consumption of a four-person household. Alternatively, the electrical power generated by the same photovoltaic panels could be used to produce 15,000 kilowatt hours of heat annually, equivalent to the heat used for 35 hot showers per day.
Behind this service are data from the Surface Solar Radiation Data Set – Heliosat, which includes data from the Meteosat Visible Infra-Red Imager and Spinning Enhanced Visible and Infrared Imager on board EUMETSAT-operated Meteosat First and Second Generation satellites, respectively. These data made it possible to determine the amount of sunlight that passes through clouds. Combining these with solar radiation models, as well as additional data, the Sonnendach team was able to determine the yearly average solar radiation received by every roof and building façade across Switzerland.
Tetzlaff is proud of the role the Sonnendach service plays in supporting the energy transition in Switzerland, where photovoltaic capacity has increased forty-fold since 2010. She is also careful to point out that this service is just a jumping-off point for people to start exploring the possibility of transitioning to solar energy themselves.
“It is important to remember that this service only offers a rough estimate of electricity and heat production with photovoltaic panels,” said Tetzlaff. “For a very precise estimate for your particular roof, you need to consult engineers to find out how many photovoltaic panels your individual roof could actually hold. That being said, before you spend the money on a precise estimate, you can use the Sonnendach service to get an initial rough estimate for free.”
Health impacts beyond temperature
The leading cause of weather-related deaths is heat stress, with more than 61,000 heat-related deaths in Europe during the summer of 2022, according to the World Meteorological Organization. Given that climate change is expected to cause more frequent and intense heatwaves, Dr Rebecca Emerton and her team created Thermal Trace, a web-based climate service that enables people to easily access free climate data on thermal stress.
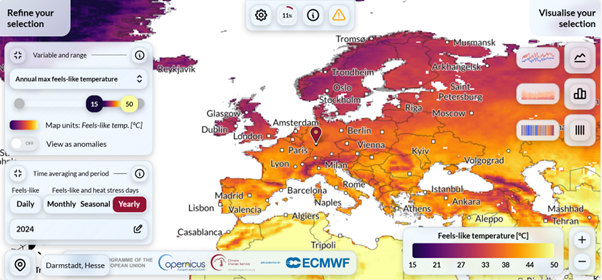
Credit: C3S/ECMWF
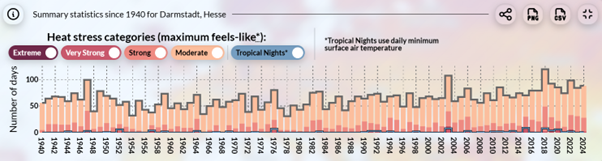
Credit: C3S/ECMWF
“Thermal stress is the umbrella term for heat and cold stress, which refers to the negative impacts on the body caused by exposure to extreme thermal conditions,” said Emerton, Diagnostics and Climate Monitoring Scientist at the Copernicus Climate Change Service, implemented by the European Centre for Medium-Range Weather Forecasts (ECMWF) on behalf of the European Commission.
“Heat waves and cold spells or cold snaps are types of hazards associated with increased health impacts and even fatalities, particularly in vulnerable groups. Heat stress can exacerbate underlying illnesses such as cardiovascular diseases, diabetes, mental health conditions, and asthma. Cold stress, on the other hand, brings with it the risk of frostbite and hypothermia.
“The important thing to keep in mind is that thermal stress is not just about temperature alone. It is a complex phenomenon, particularly when you've got the reaction of the human body to the environment. There is a range of other factors involved besides temperature, including wind speed, humidity, sunshine, thermal radiation, and also how the human body reacts to the environment.”
Through Thermal Trace, people can explore notable events such as the 2024 summer heatwaves in Europe that claimed more than 60,000 lives or the extreme cold snap in the Nordic countries in early 2024, when temperatures in Finland, Sweden, Norway, and Iceland plummeted to a feels-like temperature of below -40°C and compare these events with conditions during previous years.
“I think heat stress and cold stress are ways that people can understand the impact of climate change on themselves,” said Emerton. “When you have a summer heatwave, for example, it spurs people to understand what is going on and compare it to past events. For example, we had a very hot summer in the UK this year which a lot of people compared to the infamous very hot long summer of 1976 when we had extreme heat and drought.
“The data in Thermal Trace can help people understand and compare these types of events with real data that are consistent across time and space. I think there are a lot of different questions Thermal Trace can answer to really help people understand how the weather and climate are affecting them.”
Drought’s memory
In 2022, Central and Southern Europe experienced the most extreme drought since 1960, according to a team of researchers from the Helmholtz Centre for Environmental Research. Wildfires blazed in France, Greece, Italy and beyond, crops failed across Spain and Portugal, and Italy implemented emergency water-use restrictions.
Credit: MeteoSwiss, Swisstopo and BAFU
“Drought has a memory, and it accumulates,” said Tetzlaff. “If soil gets dry and then there is one rain event, the soil will not regain its moisture substantially. And this is why if there is a drought in July and we see it is not going to rain a lot, there is a very large likelihood to also have a drought in August.”
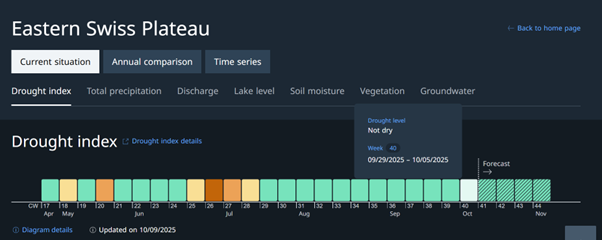
In an attempt to better inform people in Switzerland about impending drought, Dr Tetzlaff and Dr Vincent Humphrey, drought expert at MeteoSwiss, collaborated with Swiss federal agencies to create the National Drought Platform. An interactive map provides users with a ranking for each region on a scale ranging from not dry to extremely dry. It incorporates a wide range of data, including precipitation, snow cover, the water level of rivers and lakes, the volume of groundwater, soil moisture, and vegetation.
“This is our first climate service where we actually use satellite data to issue warnings in Switzerland,” said Tetzlaff. “This is where for the first time we also fully exploit the entire climate data record from the Meteosat satellites. We go back to 1991 because we want to know if, for example, the 2021 summer was particularly warm compared to the climate normal in Switzerland, that is, the average weather over the 30-year standardised period from 1991 to 2020.”
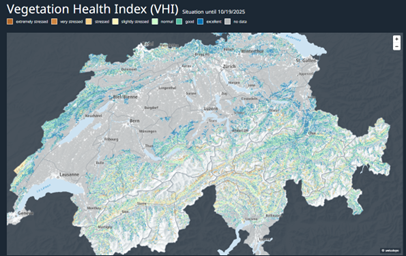
Credit: Swiss Confederation
Data from EUMETSAT satellites play a key role in the National Drought Platform through a vegetation health index, a combination of both vegetation and heat observations, which complement observations from the Copernicus Sentinel satellites operated by the European Space Agency (ESA).
“For the land surface temperature, it was important to have hourly measurements stretching back to 1991,” said Tetzlaff. “But the ESA-operated Sentinel satellites do not go back that far. We wanted to find out when it was unusually warm, which we were able to retrieve from Meteosat satellites. And by doing this, we were able to make our drought platform a true climate service. This is very important for us because we want to understand if the temperature anomalies we have been seeing are becoming more frequent in the future.”
Author:
Sarah Puschmann