Behind the data: observing California’s toxic algae from space
Satellite data reveal how nutrient-rich upwelling waters fuel harmful algal blooms along the California coast

The United Nations has designated 2021-2030 as the Decade of Ocean Science for Sustainable Development and issued ten challenges with the goal of achieving a clean, safe, and accessible ocean by 2030. To support this goal, EUMETSAT is developing case studies that demonstrate how satellite data can address each of the United Nations’ challenges. This article is the eighth in a series in which one case study author gives us the story behind the data, illuminating how satellite data from EUMETSAT and the European Union’s Copernicus programme contribute to a better future for us and our ocean.
Key points:
- In early 2025, an extensive harmful algal bloom negatively impacted the southern California coast.
- Satellite data, including observations from the Ocean and Land Colour Instrument (OLCI) on board Copernicus Sentinel-3, provide valuable insights into this event.
- Because algae are very sensitive to environmental changes, they are useful indicators of how climate change impacts marine ecosystems.
In early 2025, a harmful algal bloom spread along the California coast. EUMETSAT satellite observations provide crucial insight into the ocean processes that drove this event.
A harmful bloom
“This is an image from the Ocean and Land Colour Instrument on board Copernicus Sentinel-3. What we can see is the distinctive coastline of the southern California region from northwest to southeast with some eddies and swirls along the coastline.
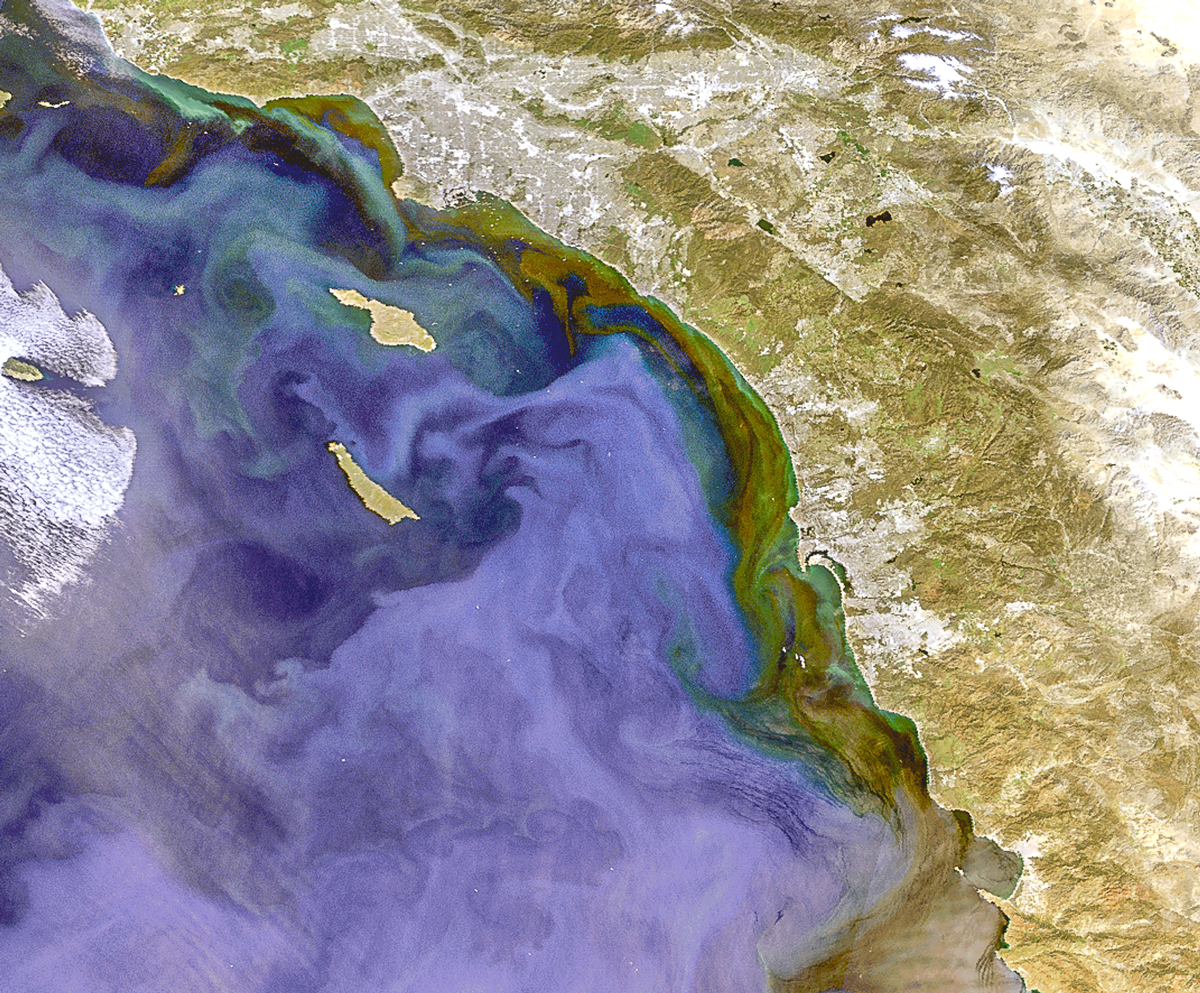
Credit: Dr Ben Loveday
“It is a region of quite dynamic flow. So, you have quite a lot of water movement. And we can see a general trend from blues further offshore towards more greens and even kind of reddish browns at the near shore.
“Often we think of phytoplankton as green and having this kind of characteristic chlorophyll colour, as many plants do. But algae, like other plants, can contain other pigments to help them to absorb light in different parts of the spectrum, too, which might provide them a competitive advantage. The impact of these pigments on the observed bloom colour can, therefore, vary with phytoplankton species and bloom intensity. Accessory pigments can absorb more of the green wavelengths, which, along with high concentrations of chlorophyll, means that the strongest blooms appear more brown or red than green.
“In addition to the phytoplankton colouring the water, sediments also colour it. The phytoplankton are growing thanks to nutrients that can be provided by the upwelling – deep waters flowing upward to replace waters flowing away from the shore – or coming in from rivers in the near-shore area.
“There are also some lighter areas and darker areas. The lighter areas mean more scattering of light. Both sedimentary particles and phytoplankton cells scatter light. So, we have a whole mix of scattering and absorption going on in these waters.
“This particular bloom has been identified as Pseudo-nitzschia. Pseudo-nitzschia is a member of the diatom group, specifically a pennate diatom. In the case of this bloom, this particular form of Pseudo-nitzschia produces domoic acid, which is a toxin and can harm marine life.
“If a person were to consume the marine life that had consumed the algae, it can harm that person as well. The toxin in this kind of Pseudo-nitzschia is actually particularly tricky because it is not destroyed through cooking or freezing. It persists through both.
“It is also worth noting that this bloom is quite extensive. It extended over a very large area of the coastline. So, there was a large swathe of the coast that had to be under warning or closed to recreational use.”
Clues in the temperature
“This is a plot of the temperature anomaly for the region compared to its average state from late 2022 to mid-2025. The positive and negative anomalies are of interest because the upwelling that fuels harmful blooms is not only associated with nutrients, it is also associated with a decrease in temperature, because the deep waters of the ocean are much cooler than the surface waters. Usually, the stronger the upwelling, the cooler the local waters will be.
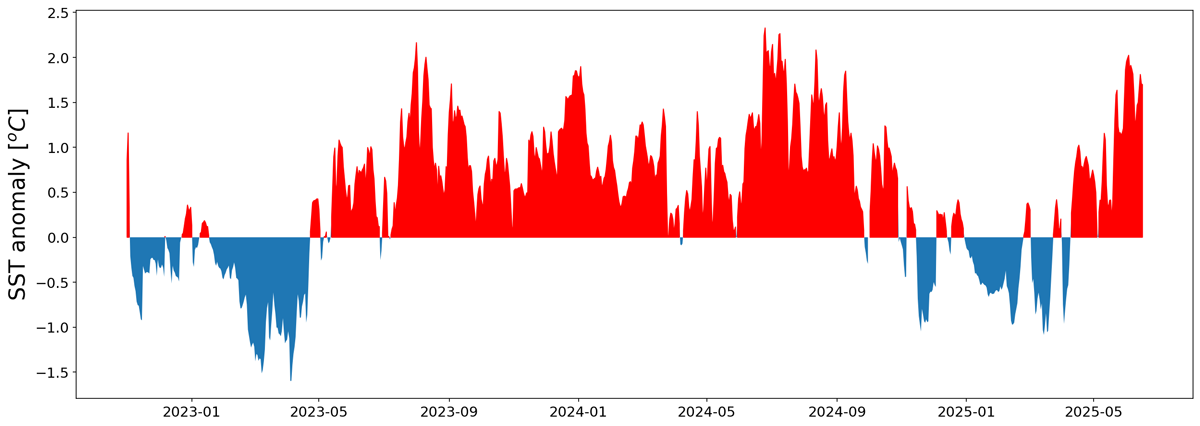
Credit: Dr Ben Loveday, using data from the Copernicus Marine Service, funded by the European Commission and implemented by Mercator Ocean International
“As you would expect, there is a natural cycle in sea surface temperature with warmer temperatures at the end of summer and cooler at the end of winter. There are also cycles in upwelling intensity with more intense upwelling in the spring and summer.
“Sea surface temperature anomalies in this region can be induced by higher or lower than normal upwelling with stronger upwelling making waters colder than expected for a given time of year. If a negative anomaly occurs during spring, which is typically a strong upwelling period of the year, then it could indicate very strong upwelling.
“That is what happened in this case. From February to April 2025, we see a really strong negative sea surface temperature anomaly just before we had this bloom period, which makes a lot of sense when we think about it mechanistically. When there is a period of more intense upwelling that pumps cold, nutrient-rich water into the surface, the algae begin to make use of those nutrients. That leads to a period when the numbers of algae will grow, but are not yet at hazardous or problematic levels. It takes some time for the algae to use up all the nutrients.
“But that means that period of very cold water, which is detectable from the temperature anomalies, could be considered as an indicator of bloom risk. This is not a guarantee that there absolutely will be an algal bloom or that such a bloom will be toxic, but it does mean there is a flow of nutrients from the deep waters that could cause excessive algal growth. Also, the cold period persisted through the bloom. The nutrients associated with the cold temperatures are probably what sustained the bloom’s relatively high intensity over a long time.
“Basically, any time that you've got this negative blue on the bottom of a chart like this, and there is more upwelling, the amount of nutrients in the surface waters increase, which sets the stage for a bloom. It is like putting fertilizer on your lawn and then a week later, your grass grows like crazy.
“The main takeaway of this chart is to consider the implications of temperature anomalies. Although there is a natural cycle of cold and warm periods, there are not always temperature anomalies. Anomalies can be indicators of a change from the ‘normal’ state of the system. For example, there was a cold anomaly in January 2023 and a cold anomaly in January 2025, but we do not see one in 2024.”
Responders to change
“Here we see that the phytoplankton have responded to the increased upwelling. There is a normal state of an upwelling region. If the amount of upwelling changes, we see a change in the phytoplankton and a change in the community structure because of differences in nutrients and differences in temperature. All of those conditions favour one group of phytoplankton over another.
“If algae can respond to subtle changes like those, they will respond to similar large-scale changes. So, if this upwelling region has changes in its wind patterns or changes in the amount of stratification because of surface heating, then the phytoplankton will respond.
“On a larger scale, climate change, which will affect things like wind patterns and what time of year the wind blows in certain directions or how strongly, will then force changes in the upwelling. This, in turn, will then force changes in the phytoplankton and that could have impacts on the local area both for recreation and for fisheries.
“So, it is a matter of finding out which phytoplankton will do better in those modelled situations with different wind patterns and stratification. And with that information, we can try to mitigate or prepare ourselves for those situations.”
Are you an expert wanting to know more?
Check out the case study where you can find the accompanying Jupyter notebook.