Behind the data: monitoring rising seas
Satellite instruments that measure sea level are crucial for climate change monitoring
Decade of Ocean Science for Sustainable Development
The United Nations has designated the 2020s as the Decade of Ocean Science for Sustainable Development and issued ten challenges with the goal of achieving a clean, safe, and accessible ocean by 2030. To support this goal, EUMETSAT is developing case studies that address each of the United Nations’ challenges. This article is the seventh in a series in which one case study author gives us the story behind the data, illuminating how satellite data from EUMETSAT and the European Union’s Copernicus programme contribute to a better future for us and our ocean.
Key points:
- The global mean sea level is rising – and this rise is accelerating.
- Observations from satellite altimeters confirm this.
- The continuation of long-term data records of sea level is essential for informing climate adaptation and mitigation strategies.
Altimetry expert Vinca Rosmorduc explains sea level rise and why it is so important to monitor.
Rising seas
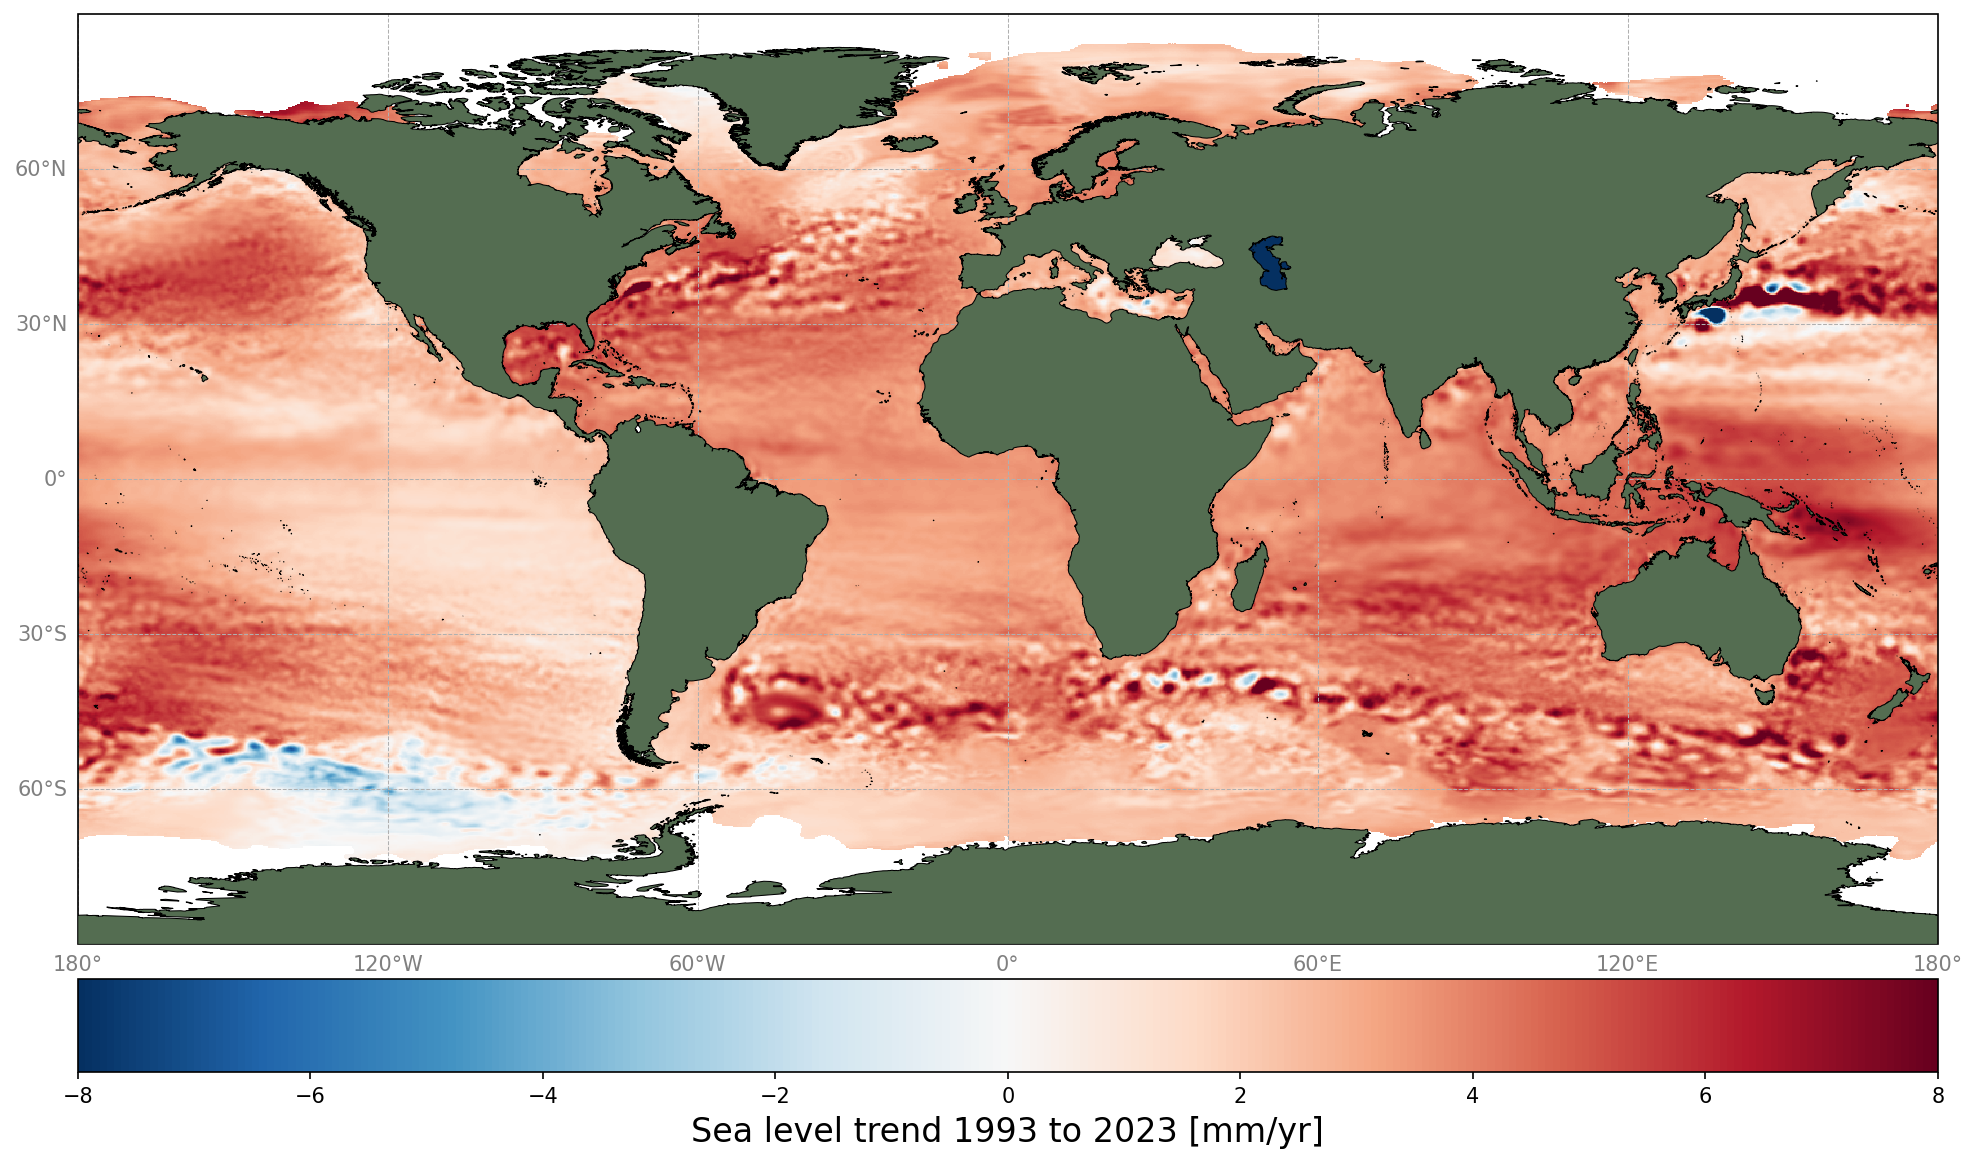
“In the image below, you can see the variations in sea level from 1993 to 2023. Nearly everything is light red, indicating a rise of about two to four millimetres per year, so about 11 to 12 centimetres over that thirty-year period, with some patches of darker red where there is even higher sea level rise. You can see this in a few places, including the Atlantic Ocean. Other places are nearly white, which are spots where there has been practically no rise. And then there are a few places, such as west of South America, that are blue, indicating a decrease in sea level.
Credit: none
“Generally, when we talk about sea level rise, we think of three main contributors. The first is that the ocean is warming, and because warmer water takes up more space than cooler water, the level of a warmer ocean is higher than that of a cooler ocean. This is known as thermal expansion. It is the same thing that happens to mercury in a thermometer – when the surrounding air heats up, the mercury heats up and expands, so it reaches a higher number on the scale.
“The second contributor is the melting of glaciers, which is when frozen water on land melts and flows into the ocean. It is important to keep in mind that melting glaciers contribute to sea level rise but melting sea ice has almost no impact on sea level. This is because sea ice, which floats on the ocean, displaces the same volume in its frozen state as it does in its liquid state. So, whether sea ice remains frozen or melts, the sea level stays almost the same.
“It is a different story when it comes to the water in glaciers. When frozen, that water stays locked on land. But when a glacier melts, that water ends up in the ocean, causing the sea level to rise.
“The third contributor, which has a very small impact globally but can have a noticeable one locally, has to do with the fact that freshwater is less dense than saltwater. Because glaciers and sea ice are mainly composed of freshwater, melting glaciers and melting sea ice contributes more freshwater to the ocean, raising the sea level.
“What you can see in this map is that although the overall trend is that the sea level is rising, it does not do so homogenously across the globe. The ocean is not static – it is moving all the time. Some variations in sea level are caused by ocean currents and El Niño- and La Niña-related events, which impact the temperature of the ocean and sea level unevenly. So, the 30 years of data that we show here is long-term but not enough to compensate for all the variations.
“I remember a study from one of the main sea level experts on the impact of El Niño on sea level rise. He said that we would need more than 50 years of data to compensate for a very big El Niño. So, despite all the data we have already, we still do not have a long enough time series of data to compensate for all the interannual and decadal variability of the ocean. That being said, the data do show that the sea level is rising, and we have further evidence that indicates this is driven by human activity.”
The rise accelerates
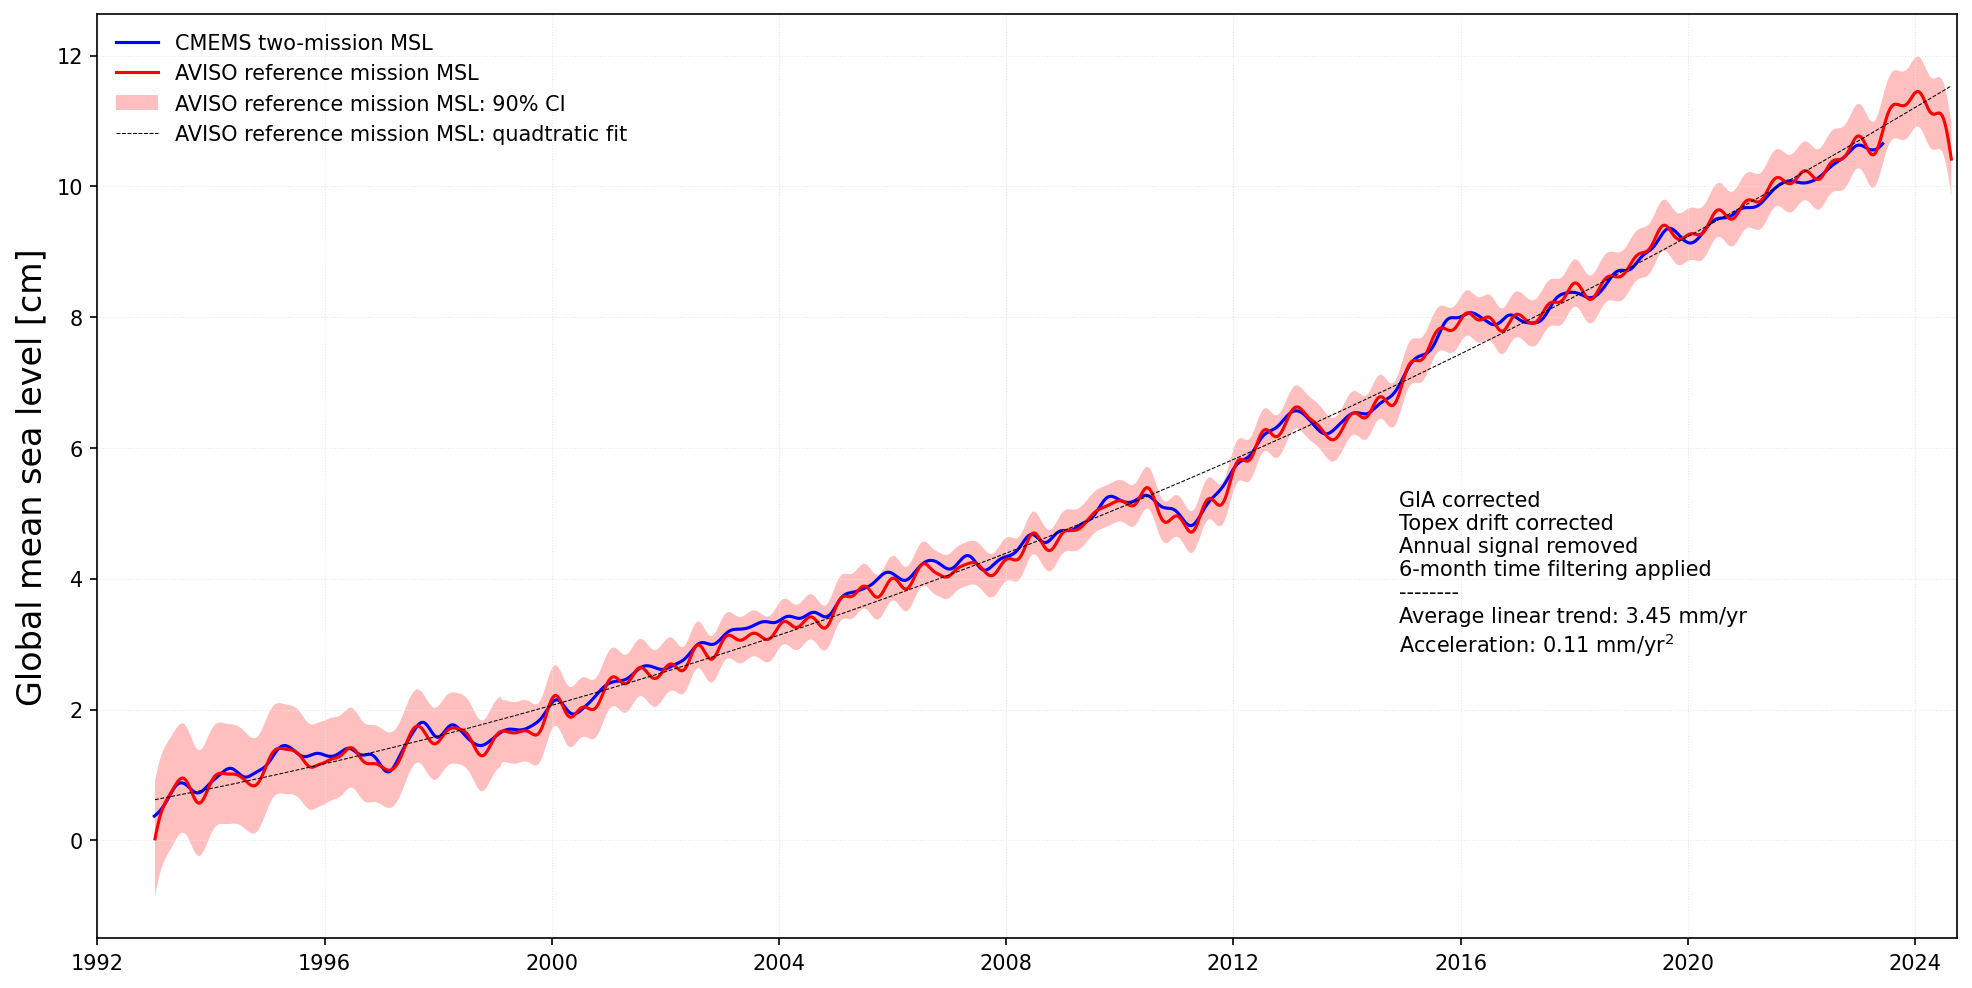
“In the image below, we see the global mean sea level since 1992. The red and blue lines show data from two different series of satellites carrying altimeters, instruments that measure sea level height.
Credit: none
“The red line shows the data from the series of successive reference missions. These missions serve as the reference for all global altimeters – that is, every altimeter is calibrated to the measurements from satellites in this series beginning with observations from the TOPEX-Poseidon satellite and continuing with Jason-1, Jason-2, Jason-3, and most recently, Sentinel-6 Michael Freilich.
“The blue line shows data from a combination of two series of missions: one being the reference mission I just mentioned and the other being European Remote-Sensing Satellite-1 (ERS-1), European Remote-Sensing Satellite-2 (ERS-2), Envisat, Saral, and now Sentinel-3. The pinkish envelope around the curves represents the error margin. While the error margin was higher at first, we have improved on that over the years, with more satellites, better knowledge, and a lot of work on the measurements, so we are more certain of the accuracy of altimetry measurements now.
“The main message from this graph is that sea level is rising – and that the rise is actually accelerating, indicated by an upward bending curve. For a long time, global sea level rise seemed to follow a straight line, but this is not the case anymore. The mean sea level is not just continuing to rise at the same rate but it is rising faster than before.
“When people hear that the sea level is rising just a few millimetres per year, some do not think much of it. But looking back at sea level rise over the past 30 years, it amounts to something like 10 centimetres. And because sea level is not just rising steadily but actually accelerating, we might have an additional 10 centimetres of rise in the next 15 years. Even if these increases still sound small, they put more areas at risk of severe coastal flooding. Even if we were to stop emitting every kind of greenhouse gas right now, the sea level would continue to rise for many more years.
"This is why it is really important to keep monitoring the sea level using satellite instruments, and why I am especially looking forward to the launch of Sentinel-6B later this year, which will extend the valuable climate data records of sea level well into the future."
Are you an expert wanting to know more?
Check out the case study where you can find the accompanying Jupyter notebook.
Author:
Sarah Puschmann