Behind the data: measuring ocean carbon
Quantifying carbon in the ocean provides crucial information about oceans’ role in climate
Marine remote sensing expert Dr Hayley Evers-King explains how satellite images of plankton can be used to identify where and how much carbon is stored in the ocean and why tracking carbon is so essential.
The United Nations has designated the 2020s as the Decade of Ocean Science for Sustainable Development and issued 10 challenges with the goal of achieving a clean, safe, and accessible ocean by 2030. To support this goal, EUMETSAT is developing case studies that address each of the United Nations’ challenges. This article is the third in a series in which one case study author gives us the story behind the data, illuminating how satellite data from EUMETSAT and the European Union’s Copernicus programme contribute to a better ocean.
Key points:
- EUMETSAT-operated satellites make it possible to track specific types of carbon in the ocean by detecting the light that reflects off the shells of coccolithophores, a type of phytoplankton
- These light measurements can then be converted into concentrations of particulate inorganic carbon
- Monitoring carbon throughout the Earth system is essential for understanding climate change
Follow the light

Credit: Dr Ben Loveday
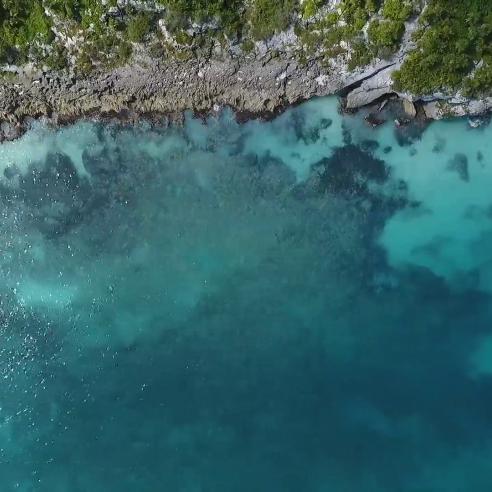
“EUMETSAT-operated satellites measure ocean colour by detecting the light that's reflected at different wavelengths,” Evers-King said. “In this image, the red, green, and blue light as measured by the satellite is combined to make an image that resembles what can be seen with the human eye.
“What you get in this image are these beautiful swirls of blue and white. The blue comes from the colour of the ocean water itself, whereas the white comes from the light reflecting off this particular species of phytoplankton called coccolithophores. They have very shiny white shells, so they reflect a lot of light back at the satellite.
“We can track carbon in the ocean when it gets taken up by biological organisms, which coccolithophores do when they use dissolved carbon in the ocean in the form of bicarbonate and carbonate ions to build their shells.
“From this satellite image we know that there was a coccolithophore bloom in this region of the Barents Sea on 13 July 2022, and it is normal for these plankton to be blooming this time of year. This gives us insight into the location of some of the ocean’s carbon at that time.
Assigning values
“The previous image was a good first step towards understanding where and in what form carbon is stored in the ocean. But if we want find out things such as how much calcium carbonate – a compound found in this type of organisms’ shells – will be produced and its role in the carbon cycle, we need to turn those measurements of light into concentrations of particulate inorganic carbon (PIC).
“We do this by comparing measurements of known quantities of inorganic carbon in the ocean to measurements of light at those points. Once we know this general relationship between inorganic carbon and light, we can take light measurements and calculate the corresponding units of inorganic carbon in the sea.
“So by quantifying the carbon, we were able to add the legend in the bottom left-hand corner of the image, which indicates how much particulate inorganic carbon was in the sea at that time.
“This is good to know but at the same time, it’s just one part of the carbon cycle. There are other parts of the ocean carbon cycle we can measure with satellites. And because carbon moves between the different parts of the Earth system – the atmosphere, sea, and land – we need to understand the system as a whole.
“Monitoring carbon throughout the Earth system is really, really important because we can’t accurately predict what's going to happen with the climate or say how effective various remediation measures are without keeping track of carbon.”

Credit: Dr Ben Loveday
Are you an expert wanting to know more?
Check out the case study where you can access the accompanying Jupyter notebook as well as EUMETSAT’s repository of ocean case studies.
Author:
Sarah Puschmann