27 January 2023
17 August 2021
For any earth observation mission, quality control activities undertaken for the monitoring of Level 1 mission products are fundamental. This study aimed to develop a new tool for the geometry quality assessment (GQA) of such products for missions operated by EUMETSAT.
The study started with an algorithm review and definition, followed by a tradeoff analysis. The final algorithms selected from this phase were then prototyped into a tool based on Python. The tool can evaluate three main types of GQA, i.e. absolute, temporal and inter-band errors. The method relies on dense image matching with sub-pixel accuracy. Global image mosaics with higher spatial resolution and accuracy were used as references for the absolute accuracy evaluations and applied to EUMETSAT Level 1 mission products.
In the first study phase, the geometric performance of Meteosat Second Generation (MSG) SEVIRI Level 1.5 products, in terms of absolute geolocation, band-to-band registration and multi-temporal stability, was assessed and studied in detail. The results obtained from the tool were thoroughly validated with GQA results from the EUMETSAT operational SEVIRI Level 1 processor.
In a second study phase, the GQA tool was used for the geometric performance assessment of Sentinel-3A/3B OLCI and SLSTR sensors, as well as Metop AVHRR.
The study also included further work on the improvement of the textural enhancement method for thermal infrared bands and establishing procedures for the quality assurance associated to reference data.
Objectives
The objectives of the study were:
- Scientific review and requirements consolidation.
- Algorithm definition and product monitoring tool development.
- Applying product monitoring operations to real Level 1 mission products.
- Product monitoring algorithm evaluation and validation.
In addition to implementing the assessment of the three GQA criteria (absolute, inter-band and multi temporal geometric performance), the following objectives were considered important for the tool development:
- Ensuring outputs with high geometric accuracy and dense geographical coverage.
- A focus on the selection of proper reference data for absolute geometric performance assessment.
- Methods that work in a broad range of the optical spectrum, i.e. visible and infrared bands.
- An approach that relied on the image textural content, and features other than coastline features.
- Algorithms that are applicable to geostationary missions as well as missions hosted on LEO (Low Earth Orbiting) satellites.
- A design that could run as standalone software.
Overview
Requirements for the GQA tool were defined at the beginning of the project and captured in a Requirements Baseline Document. The particular focus of the study was to identify methods for the detection of invariant texture features over land areas, i.e. complementary to coastline or lake features, which can serve as landmark features for GQA purposes. These methods had to be applicable to medium resolution (3 and 0.5km) imagery acquired from geostationary orbit (typically MSG SEVIRI), and also for LEO sensors.
In a second step, based on the results of the study algorithm assessment, a tool was prototyped. The GQA tool includes a core processing engine and a visual interface to allow operation. The tool ingests EUMETSAT MSG Level 1.5 products, or Sentinel-3 OLCI/SLSTR and EPS AVHRR L1B products, and performs the assessment of the following three key geometric quality items (so-called GQAs):
- Absolute navigation.
- Channel-to-channel registration.
- Temporal registration.
The operator monitors the accuracy results above interactively via a graphical interface; it is, therefore, possible to perform accuracy analysis, comparison, and trending, depending on the quality item. New mission products can be easily integrated with the inclusion of suitable readers.
The research and engineering approach has been to design and develop a core algorithm for Ground Control Point (so-called keypoints - KP) selection and matching, and the main algorithms are common to the three GQAs. All work was captured in a two-part study report. Included within the tool framework was the implementation of the core algorithms, which interact with other functional components to execute different workflows depending on the GQAs.
The study elaborated on the following research and development activities:
- Investigations on the global reference data: GSHHS, GLS2010 and Landsat, Sentinel-2 global mosaics and MERIS global mosaics were investigated.
- Preparation of high quality reference global mosaics.
- Evaluation of various feature and texture extraction methods for enhancing the image information and obtaining dense keypoints.
- Evaluation of different image matching methods to obtain reliable results for different spectral bands with sub-pixel accuracy.
- Method selection based on the investigations and tool development with Python.
- Tool verification and validation for the three GQA types using MSG SEVIRI Level 1.5 images and various reference images.
- Applying the tool to the LEO missions Sentinel-3 OLCI, SLSTR and EPS AVHRR for the three GQA types.
- GQA tool adaptation and optimization especially for image and data load, geometric pre-processing.
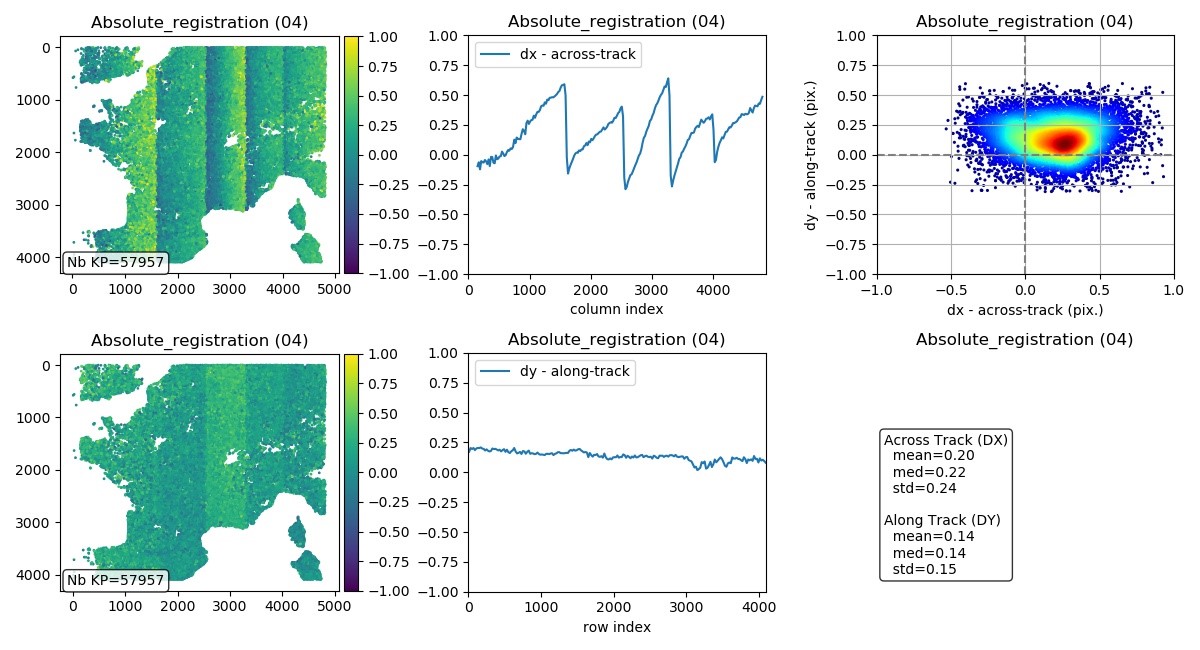
Some example outputs are shown below:
GEO case: MSG SEVIRI
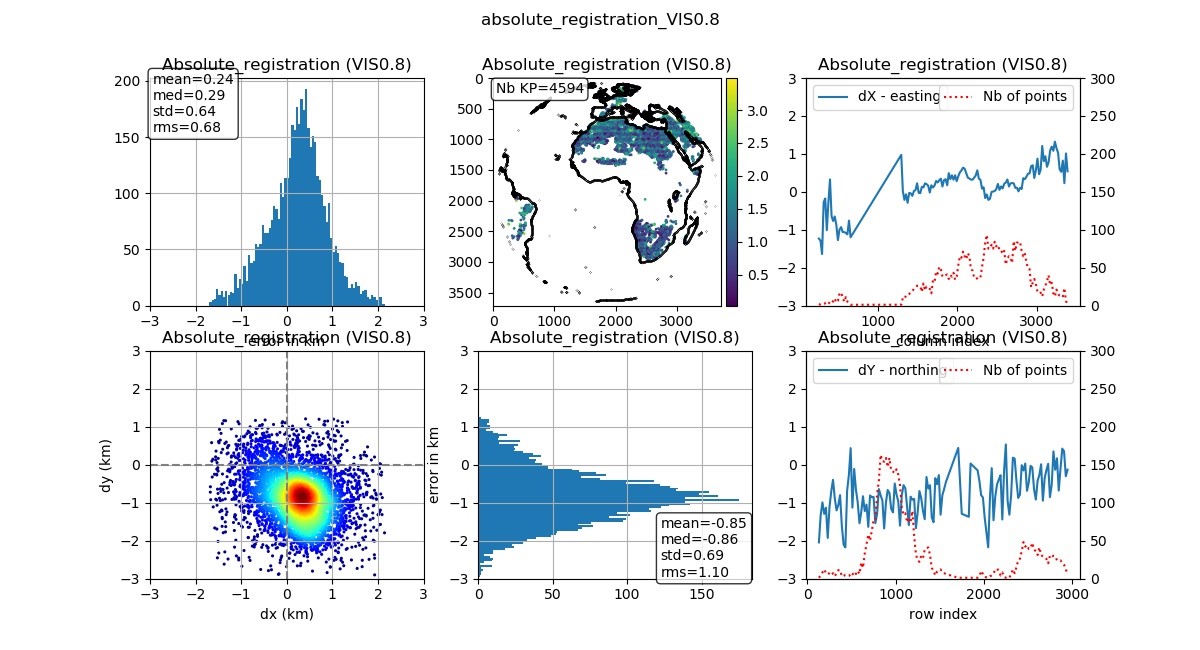
LEO case: Sentinel-3 OLCI