2019 - Another record-breaking year for our planet
The summer headlines have brought news of scorching temperatures, devastating wildfires and worrying predictions for the future of our planet.


What effect do these extreme weather phenomena have on our climate and how do we predict what's in store for the years to come?
25 February 2021
22 August 2019
A changing climate.
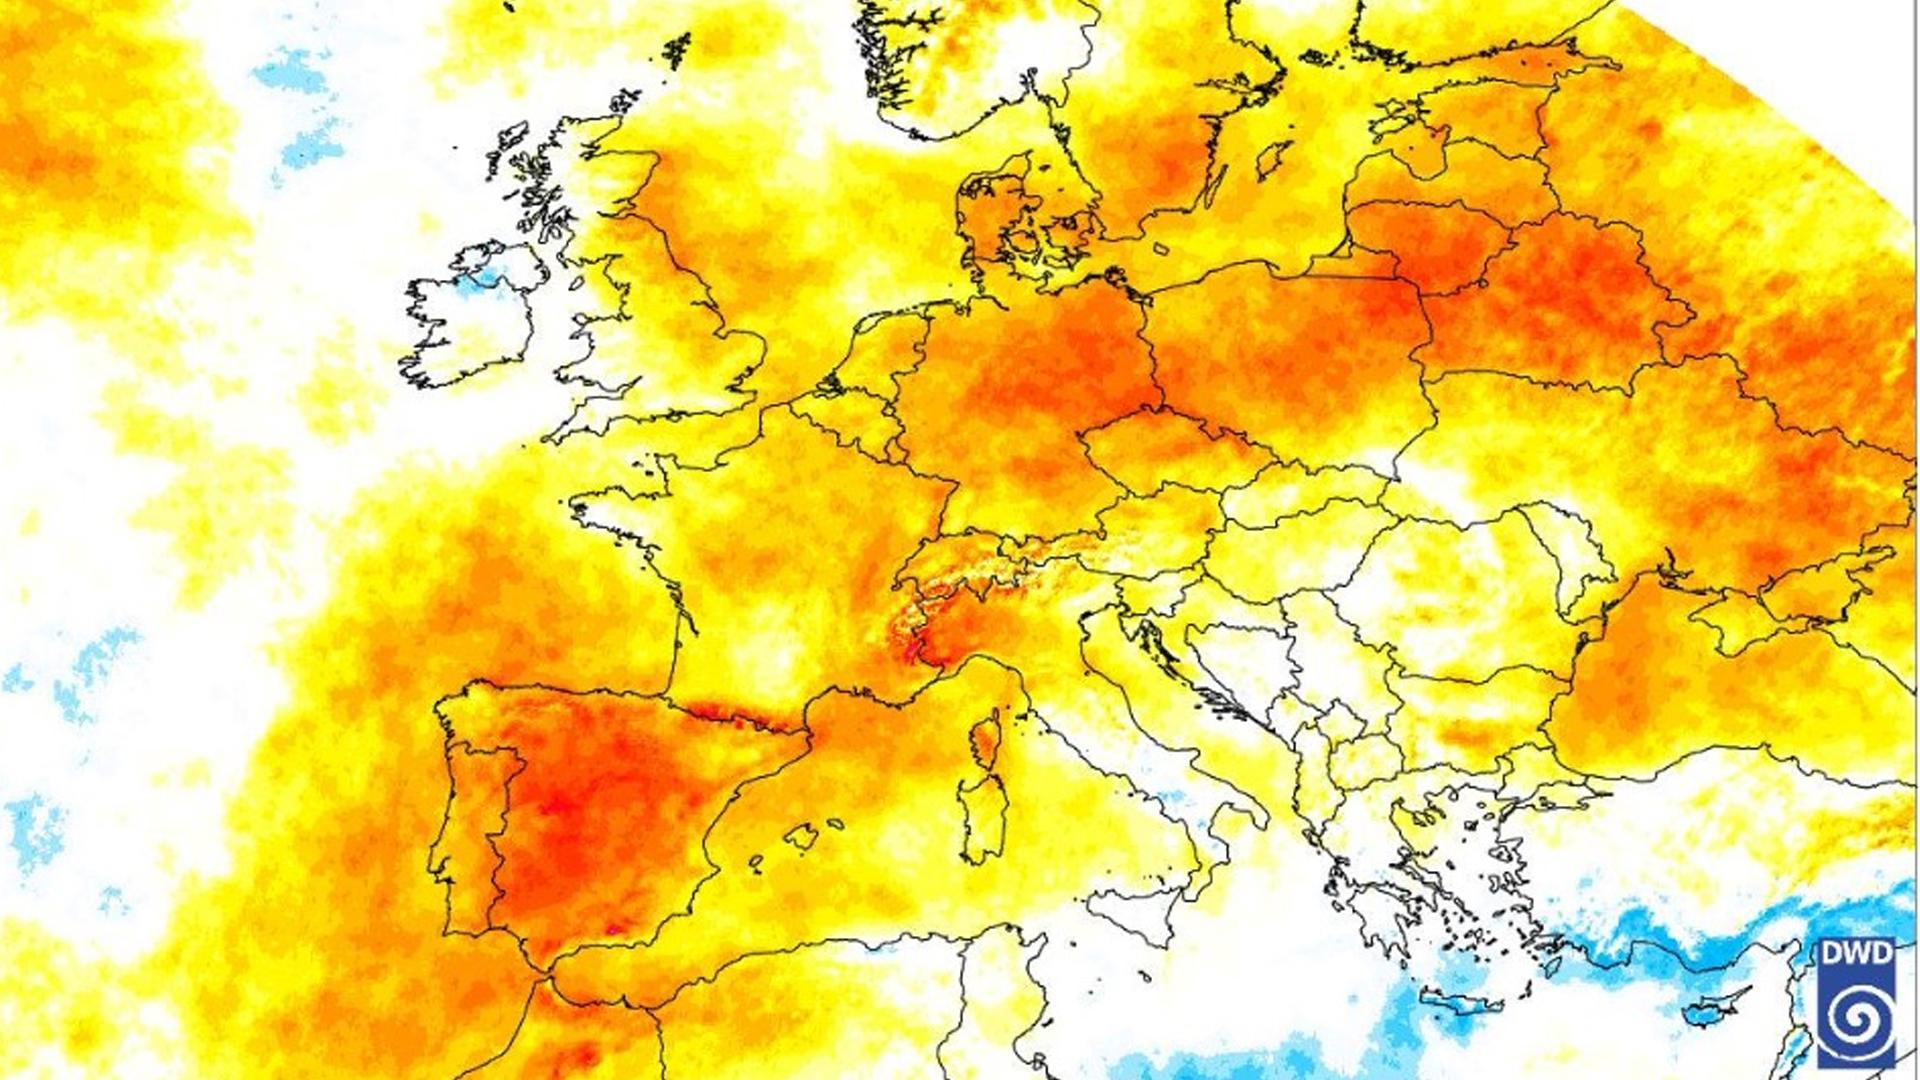
Reports show that our planet is getting warmer, with the Earth having its hottest June and July ever on record in 2019. As a result, the Greenland ice has also melted at record levels. Globally, July 2019 was marginally warmer than the previous hottest month on record (July 2016) which in itself is alarming, as July 2016 was preceded by an El Niño event that increased Pacific sea surface temperatures, generally also raising global averages. Heatwaves are becoming more commonplace and this has severe impacts on not only human beings, but the planet as a whole. Some examples of how rising temperatures affect the planet are:
- Sea level rise
- Extreme weather events (such as tropical storms)
- Shrinking sea ice
Data shows us some of the outcomes we might expect in the future if this current trend continues. Keeping an eye on the health of the planet and recording its data are extremely important in order to know:
- What we're dealing with as it's happening, e.g. getting a better idea of how a storm is forming
- How long that particular event might continue, e.g. tracking wildfire activity
- What could happen years from now (by comparing new data with old)
With the help of satellite observations, EUMETSAT and its international partners are able to monitor the Earth every single day providing continuous coverage through the watchful eyes of the various instruments on board each spacecraft. There are many people involved in gathering and processing this invaluable data, which is then distributed to users and organisations around the world.
The data gets turned into clear information in the form of weather forecasts, climate indicators or severe weather warnings. For example, satellite observations have allowed scientists to keep track of the recent wildfires in the Arctic Circle. From this data, we know how big or severe the fires are and how much smoke is being emitted. This information can be provided to the public in a timely and accurate manner in order to inform on possible health risks for affected populations.

Thanks to the years of historical data we already have, we can also monitor for any changes and better forecast based upon the patterns we keep seeing.
"Only long-term and consistent observations of the Earth system allow us to quantify the impacts of climate variability and change on the natural and human dimension. From this understanding, we can estimate and eventually predict future states of the Earth system and quantify its vulnerability and resilience to continuing anthropogenic forcing. With accurate climate predictions, we can help to decide on adaptation strategies to protect our living planet and to secure socio-economic welfare. (Rainer Hollmann, Scientific Coordinator at CM SAF)"
CM SAF
The EUMETSAT Satellite Application Facility on Climate Monitoring (CM SAF) is specifically tasked with delivering climate data records and services based on the observations of various instruments on board operational meteorological satellites. These satellites are operated by EUMETSAT itself, but also by other agencies such as the National Oceanographic and Atmospheric Administration and the Japanese Meteorological Agency. The CM SAF is responsible for processing and presenting long-time series of satellite observations so that it can be used by scientists, researchers, operational services and economists. It is developing, generating, archiving and distributing high-quality satellite-derived climate data records that characterise the energy and water cycles. These climate data records are in support of monitoring, understanding and adapting to climate variability and climate change for the following application areas:
- Monitoring of the state, variability and trends of the climate
- Benchmarking of climate models and process studies in order to improve climate predictions
- Developing adaptation strategies and other applications of climate data

"Satellites provide comprehensive observations of large regions and the entire globe. Only the operational meteorological satellites cover sufficiently long time periods with sufficiently consistent observations to characterise many essential climate variables with thoroughly quality-controlled and reviewed climate data records. This is what the CM SAF is providing for the atmospheric energy balance and water cycle. (Johannes Kaiser, Operations Manager of CM SAF at DWD)"
CM SAF products, users and services
The operational products of the CM SAF are generated at the institutions of the consortium partners and also the processing facilities at EUMETSAT headquarters and the European Centre for Medium-Range Weather Forecasts (ECMWF). The products primarily provide geophysical properties related to the atmospheric cloud and radiation fields. New developments are addressing global (land and ocean) precipitation, amongst others. You can find out just how the facilities work together by reading a previously published article by the DWD here.
The CM SAF had 3780 active users from 132 countries at the end of June 2019. The users comprise national meteorological services, research institutions, private companies and other government services. They submit about 5000 orders per year, and CM SAF delivers accordingly - the numbers are continuing to rise.


You can find out more information on the CM SAF by visiting their website and follow their activities on Twitter, as well as download products from their web user interface.
You might also like to download the American Meteorological Societies’ publication “the State of the Climate in 2018” for further reading and comparison.
Related links:
- https://cm-saf.eumetsat.int
- https://www.dwd.de
- https://www.cmsaf.eu/EN/Highlights/Dokumente/News_27.html
- https://public.wmo.int/en/media/news/july-equalled-and-maybe-surpassed-hottest-month-recorded-history
- https://www.livescience.com/65930-greenland-ice-sheet-sliding.html
- https://time.com/5622632/thwaites-glacier-antarctica-melting/
- https://japantoday.com/category/world/dramatic-warming-projected-in-world%27s-major-cities-by-2050
- https://www.bbc.com/news/uk-49085806
- https://www.theguardian.com/uk-news/2019/jul/31/uks-10-hottest-years-on-record-have-occurred-since-2002-met-office
- https://edition.cnn.com/2019/07/19/us/june-2019-hottest-on-record/index.html
The CM SAF is an integral part of the distributed EUMETSAT Application Ground Segment. It is the joint activity of national meteorological and hydro-meteorological services and research institutes from Belgium (the Royal Meteorological Institute), Finland (the Finnish Meteorological Institute), the Netherlands (the Royal Netherlands Meteorological Institute), Sweden (the Swedish Meteorological and Hydrological Institute), Switzerland (the Federal Office of Meteorology and Climatology MeteoSwiss), United Kingdom (Met Office), France (the French National Centre for Scientific Research) and Germany (the German Meteorological Service) and co-sponsored by EUMETSAT. The head office is based at the German Meteorological Service the Deutsche Wetterdienst (DWD).
This article includes contributions from:
- Rainer Hollmann, Scientific Coordinator at CM SAF
- Kenneth Holmlund, Chief Scientist at EUMETSAT
- Johannes Kaiser, Operations Manager of CM SAF at DWD
- Lothar Schüller, SAF Network Manager at EUMETSAT


