
Climate and climate change in the Arctic
The latest report from the students following the MOSAiC expedition discusses the Arctic climate, where the RV Polarstern is currently located and trapped in ice.

The crews on the expedition are facing very challenging conditions while they continue their work on board the research vessel. Read on to find out what makes the Arctic such a hostile part of the world and what effect climate change is having on its environment.
09 August 2021
28 April 2020
Blog six
Gathering data during the Arctic winter
Authors: Fabian Baur and Bruno Kothe
Climate and climate change in the Arctic
The research of climate and climate changes in the Arctic is much more challenging than in the Antarctic. While the Antarctic is a continent surrounded by the Antarctic Ocean, it is the opposite in the Arctic – in fact, it is a sea surrounded by continents, the so-called Arctic Ocean on which a layer of ice is floating. The layer is several meters thick and parts of it were formed about one million years ago.

While the demarcation of the Antarctic is relatively simple – it includes the Antarctic mainland and the surrounding pack ice – the demarcation of the Arctic is much more difficult. The previously used definition that everything belongs to the Arctic, which lies north of the Arctic Circle, does not do justice to the climatic conditions in the region, as the ocean currents in the areas of the Arctic Ocean have a significant impact on the climate. Nowadays, we use the following definition: "The Arctic includes any area where the average temperature in the warmest month (July in the northern hemisphere) does not exceed 10°C."
Thus, the Arctic includes the north of Canada, Alaska, Iceland, Svalbard, Greenland, the north coast of Russia and the Bering Sea.
The Arctic Ocean is up to 5669m deep, and with 14.09 million km² of water, the smallest ocean in the world. The average water depth measures only 987m, making it a rather shallow body of water. The temperature of the Arctic Ocean has risen by 0.9 degrees Celsius per decade since the mid-1970s. Although the Arctic Ocean is the world’s smallest ocean, the changes that take place here have a major impact on the global climate.
To collect more accurate data from the arctic winter, the MOSAiC project was created. It is expected to supplement and deepen existing data, based upon the interaction of the atmosphere, ice, ecosystem and ocean.
Stations in the Arctic
The history of polar research in the Arctic is closely linked to expeditions in the 19th and 20th century. As early as the end of the 19th century, researchers recognised the global influence of weather effects in the Arctic. The first International Polar Year took place from 1882 to 1883 as a joint research enterprise of 11 European states and the USA on Arctic terrain. The internationally coordinated polar-research projects focused on meteorological and geomagnetic investigations and the study of the Northern Lights.

From the German side, the Alfred Wegener Institute Helmholtz Center for Polar and Marine Research (AWI) and the Federal Institute for Geosciences and Natural Resources (BGR) are the central research institutions active in the Arctic.
The AWI itself maintains two long-term stations in the Arctic region: The Koldewey Station in Ny-Ålesund, which is the world’s northernmost, permanent civilian research station. The observation of the stratosphere is an important task for the base.
The second fixed research station – Samoylov – is maintained by AWI in the Lena delta near the Laptev Sea. The station is much smaller and serves mainly to study the Siberian permafrost. Another important pillar of German polar research is the research and supply vessel RV Polarstern.
Climate
The Arctic is located in the so-called “frigid zone”, which extends from 60° N to 90° N. This climate zone is again divided into a polar and a subpolar zone.

Characterisation of the Polar Climate Zone
Due to the shallow Sun angle and the polar night in winter (in which the Sun does not rise at all for almost half a year), the temperatures are very low. Only during the polar day – in the summer months – does the air warm slightly.
Due to the low maximum humidity, this cold air can absorb only a small amount of water vapour, so that hardly any precipitation falls. In addition, the polar climate is under the influence of the polar high and the polar east winds. During a polar high, cold air sinks and thus suppresses the formation of clouds.
The subpolar climate zone is characterised by low temperatures that rise above freezing only in the summer months. Rainfall is low throughout the year, but slightly higher in summer. In winter, the subpolar climate is influenced by the polar-east winds. The higher rainfall in summer is caused by the northwestern westerlies. These also have a higher water vapour content in their warmer air.
The subpolar grassland is called a “tundra”.


Influence of climate change on the development of sea ice
In general, the observation of sea ice is not an easy task. The measurement of the extent is achievable by satellites, but data on the thickness of the ice sheet is more difficult to obtain.
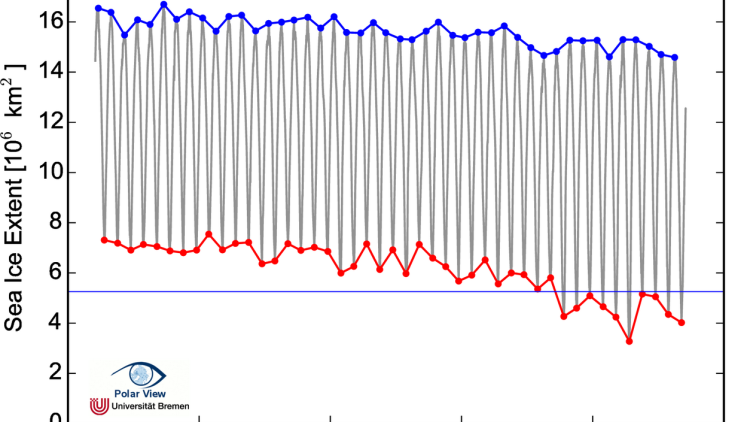
When observing Arctic sea ice extent, two time frames are crucial in order to record data: once in September where the extent is the lowest and in March, where it is the highest. Since records began in 1979, the total area has been decreasing over the years. In 2016, the minimum area was 4.35 million km², already about 42% smaller than in 1979 (7.5 million km² in summer). The smallest extent was measured in 2012 with only 3.41 million km².
In addition to the ice extent, the thickness of the ice and therefore the volume is affected by the constant warming. The volume varies as the extent in the seasonal manifestations of maxima and minima. The value is also characterised by the multi-year ice concentration. Multi-year ice is defined as ice that has survived at least one melting period and therefore has increased in thickness. The concentration changes quite strongly from year to year, but there has also been a decline since 1979.
One reason for faster Arctic warming – polar amplification
Polar amplification is the unusually high warming of the upper northern latitudes. Since 1875, the area north of 60° N has warmed 1.36°C per century; about twice the global average, and at the beginning of the 21st century even 1.35°C per decade. In relation to the warming, reasons for it as well as mechanisms are known, however as for the interaction with each other – this is not yet adequately understood.

The main causes of Arctic amplification are as follows:
- The snow and ice albedo feedback
- The cloud and water vapour feedback
- Missing vertical heat transport
- Horizontal heat transport
Snow and ice albedo feedback
As most of the warming takes place in autumn, the associated sea ice extent and duration is considered the most important cause. In the summer months, the sea ice isolates the relatively warm ocean from a colder atmosphere. As the ice sheet is reduced, the overlying atmosphere heats up more. With an overall increase of temperature, the summer melting period is extended.
The resulting dark water surface absorbs additional solar radiation, which additionally heats the mixture layer (upper 20m) in the ocean and favours more melting. With the onset of winter, new ice forms, but this is thinner and can therefore melt faster in the next summer and increase the warming of the ocean.
Cloud and water vapour feedback
Clouds have two major functions in terms of radiation. On one hand, they reflect solar radiation, which supports cooling. On the other hand, they also reflect long-wave heat radiation emanating from the Earth and thus have a “greenhouse effect”. In the polar areas clouds have a warming effect, especially during the polar night, when the solar radiation can be neglected. As the temperature increases, so does the water vapour content in the atmosphere, causing it to heat up further. Also, the increased level of water vapour can form more clouds.
Missing vertical heat transports
The stratification of the lower atmosphere in the Arctic is generally quite stable. This makes vertical or dynamic processes difficult. As a result of this, the ground-level air layer in particular heats up as it does not mix with higher air layers.

Horizontal heat transport
Atmospheric dynamics also influence the temperature of the Arctic. Thus, the polar vortex, which lies between the middle troposphere and lower stratosphere, is weakened by the increased warming. This leads to a meridional exchange of air masses. It comes as cold air bursts in the direction of Europe, and warmer air flows from the south – the latter particularly contributes to the heating.
Another fascinating report from the students. Let us know what you think! New reports coming very soon… Don’t forget, you can track the MOSAiC expedition’s progress here.