RV Polarstern, Southern Brazil abeam, 27 March 2017
We look back to a very calm weekend without any surprises.

East of Brazil, a wide high moved further east, intensifying a little. On its south-western side, we sailed in a north-westerly stream at first, force 5 to 6 Beaufort.
11 March 2021
28 March 2017
A trough that is clearly visible in the satellite image (figure 1) at the bottom of the image (about latitude 42S) moved also east, passing us in the south on Friday, but did not affect us. Also recognisable is the stratus between our position (marked) and the trough that gave us the poor visibility until Friday morning.

Ahead on our track, one can identify low convective clouds that guided us over the weekend (fig. 2). Further north, near the top of the satellite image, a thunderstorm low had established that moved east over the weekend and will not harm us.

A word about the satellite images. Those of the readers that are familiar with looking at such images might be irritated about the colours shown in these colour composites.
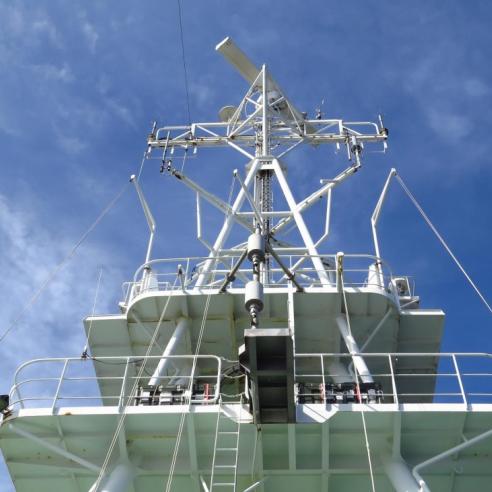
On board the vessel, a receiving station for polar orbiting satellites is operated, managed by the weather technician. It has a Ka-Band antenna, to receive AVHRR-data from NOAA and EUMETSAT.
When operating in polar regions, the weather crews have found that the commonly used composites are not optimal for their purpose, so they have tried to find combinations that show better contrasts especially in iced regions.
This has led to the composite shown which is made from the near-infrared channel and both the visible channels, but in a different order compared to the commonly used approach, showing low clouds in grey-blue and high ice clouds in yellow.

Back to the weather. Behind the mentioned trough, another high established and intensified, south of our position.
With decreasing pressure gradients on our track the wind speed decreased until Saturday night to about 2 Beaufort.
Then, suddenly but not surprisingly, we were no longer on the south-western side of a high but on the northern side of another. That change happened to occur at about noon on Saturday, clearly detectable in the wind direction: within a few hours wind turned counterclockwise from north-westerly to westerly directions, towards south-easterly to easterly directions.
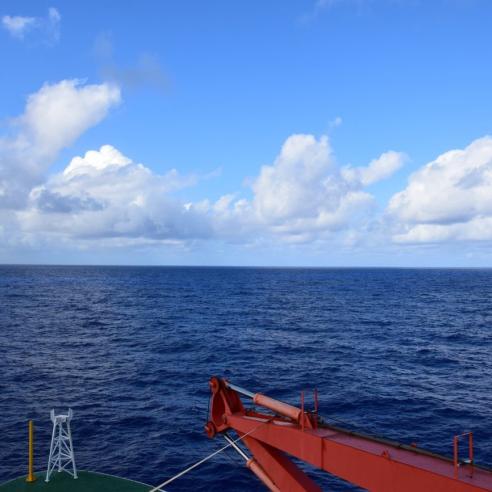
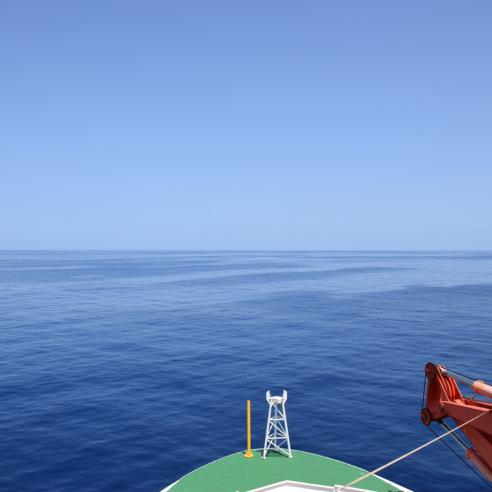
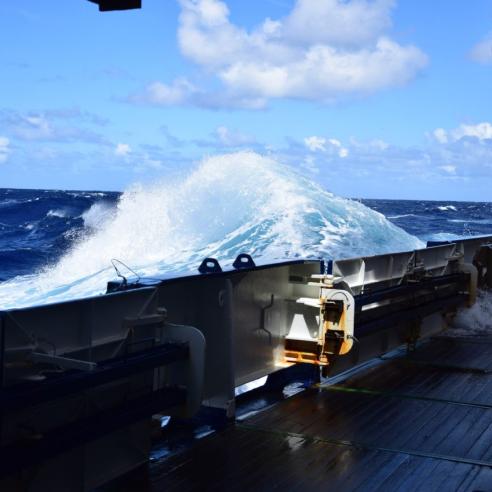
In this time period, wind speed has decreased to only 1 to 2 Beaufort, but with increasing distance from the centre of the high, wind has increased again slowly, to 5 Beaufort on Sunday evening. The difference between these two wind speeds can be seen by looking at images 3 and 4.

Don't be fooled by image 3. Even on this image you see a swell of about 1.5 m, making the vessel pitch.
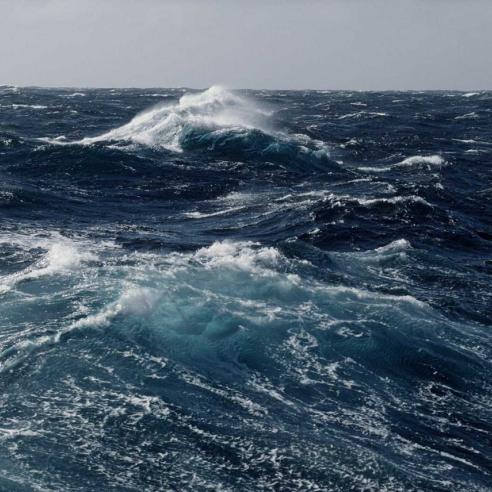
What makes the situation at the time of image 4 a bit less comfortable is not the height of the sea but the fact that now the sea is coming more from abeam, making the vessel not only pitch but also roll. Never mind! But it gives the opportunity to get nice wave pictures (fig. 5).