
See into Earth's atmosphere like never before
First images from the Meteosat Third Generation Sounder 1 satellite capture storms, moisture flows and temperature patterns in unprecedented detail

Through a thermal camera's lens, invisible worlds emerge: safety inspectors can identify gas leaks from buildings and firefighters can see how fires are spreading and how hot they burn.
Surface and cloud temperatures
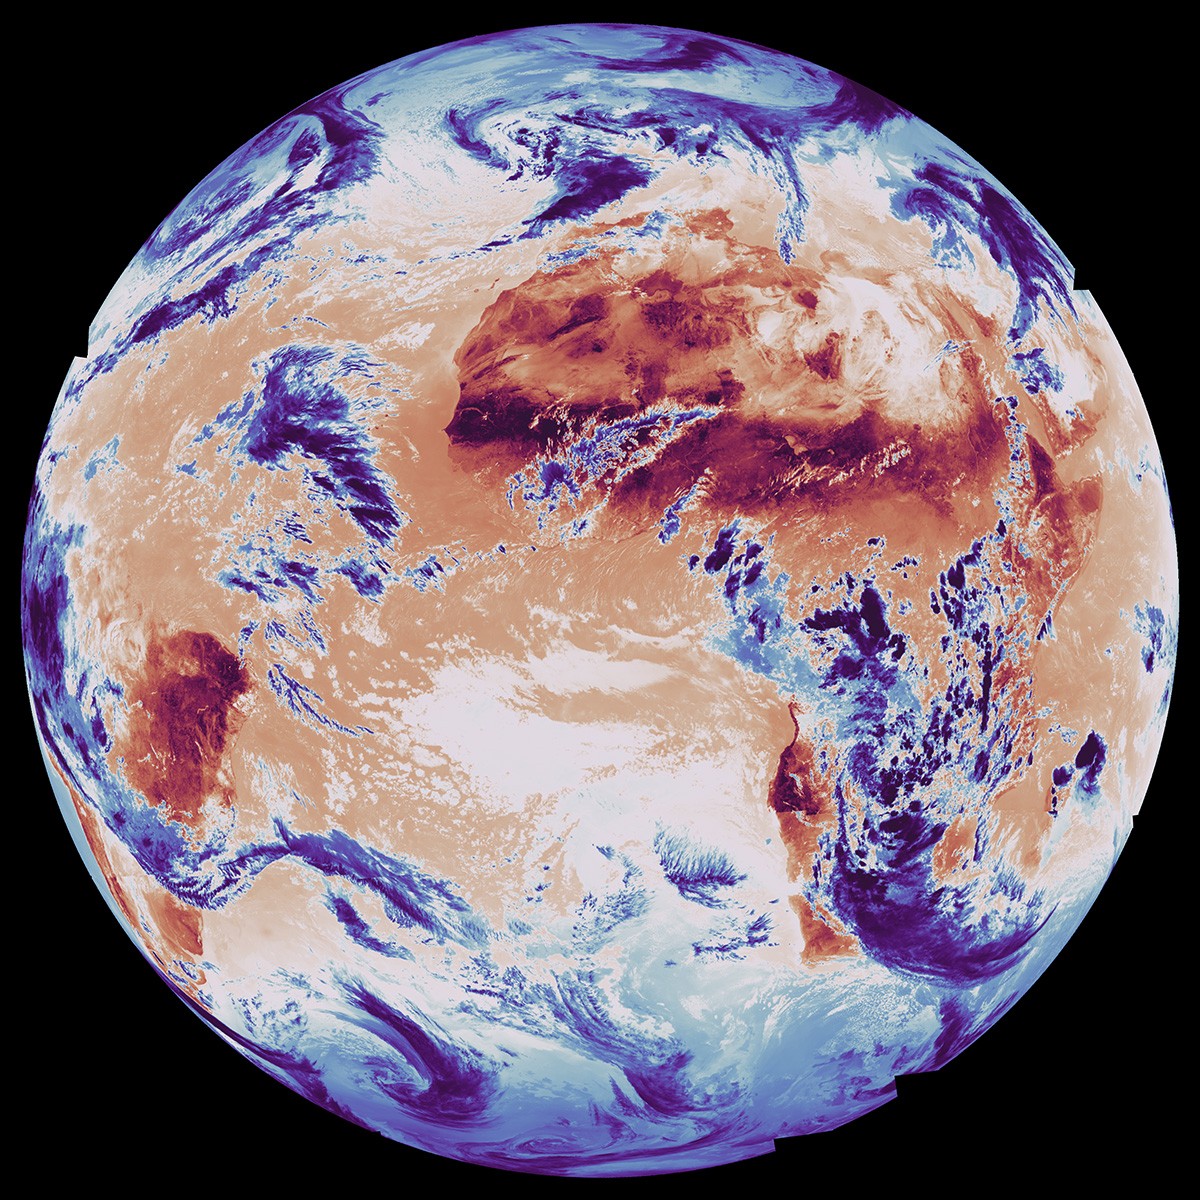
The first Infrared Sounder image viewed through this long-wave infrared channel (around 8.3 micrometres, one of nearly 2,000 channels measured simultaneously) shows clouds associated with Storm Claudia over western and southern Europe, which brought widespread disruption, heavy rain and flooding. Light at this wavelength passes largely unabsorbed through the atmosphere, revealing temperatures of cloud tops, land, and ocean surfaces. Deep blues mark the coldest features: polar ice and the tops of cumulonimbus clouds, which can be seen clearly over parts of Europe and sub-Saharan Africa where widespread convective activity associated with the Intertropical Convergence Zone spans from the Atlantic to Madagascar. Warmer yellows indicate ocean waters and whites indicate thin clouds such as low-level stratus and cumulus, while the surface of the Saharan desert swings between dark red when heated and cooler tones after nightfall.

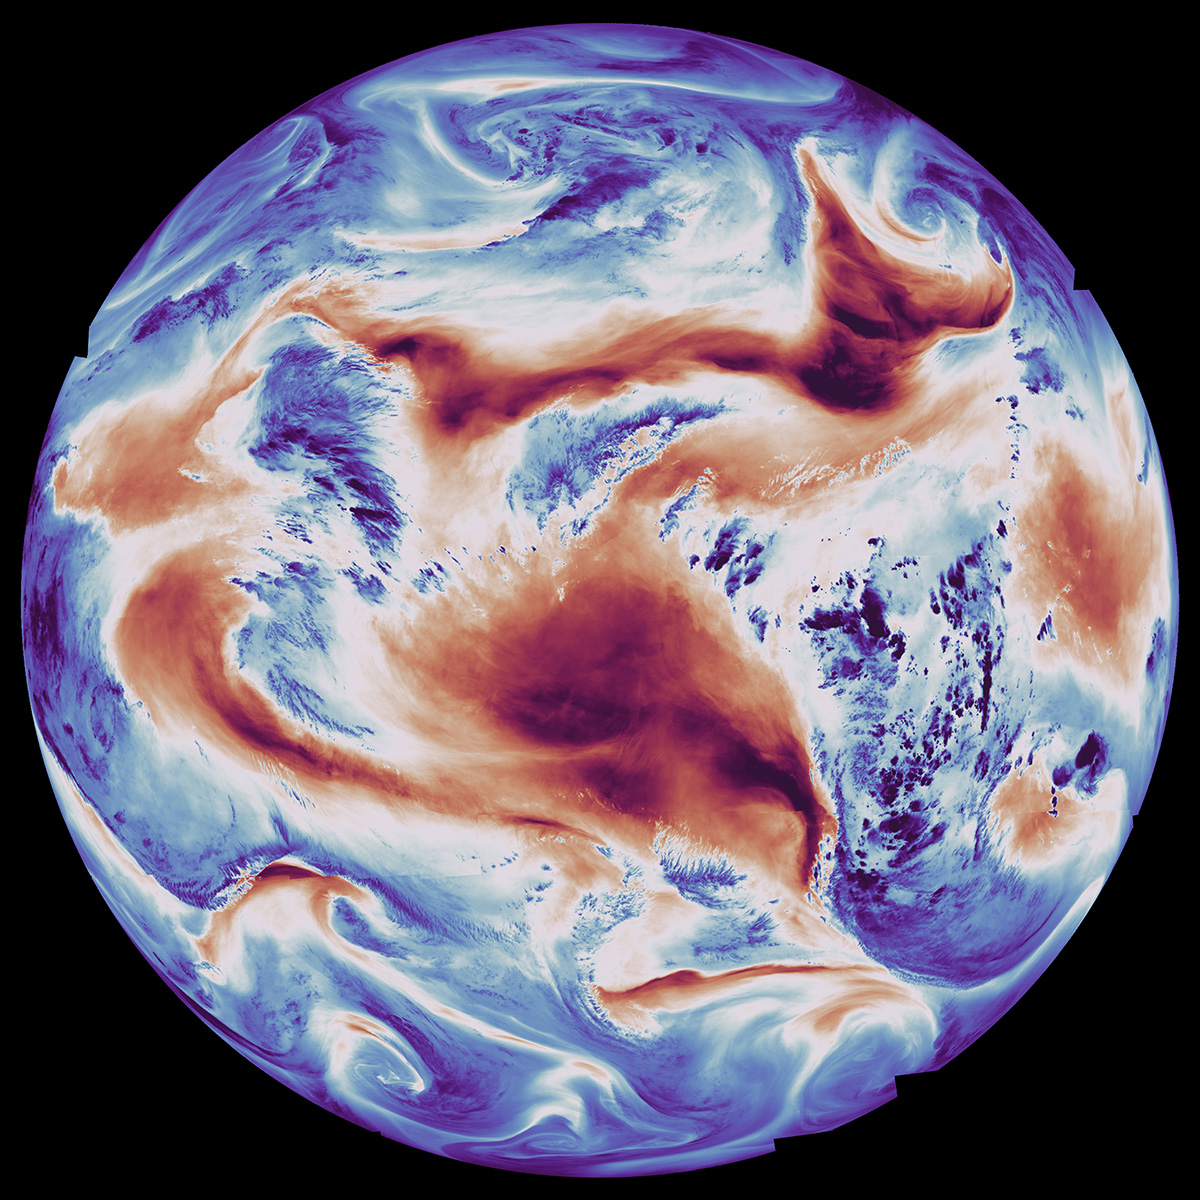
Atmospheric humidity flows
Turn the dial to a medium-wave infrared wavelength and atmospheric humidity flows become visible. Dense moisture appears as dark blue bands over the Atlantic while drier regions show red. This wavelength (around 6.2 micrometres) captures water vapour movements driving weather at continental scales. These patterns reveal jet streams along the red bands in the mid-latitudes, marking where cold polar air meets warmer air – key regions for the development of low-pressure systems. Long moisture bands stretching from the subtropics to Europe also signal atmospheric features that have the potential to deliver intense rainfall. These observations will feed into weather models every 30 minutes over Europe, enabling forecasters to track the environments driving weather events in unprecedented detail.
The last acquisition used to reconstruct the lower part of these first images was made at 15:30 UTC on 15 November 2025, while the upper part was recorded between 12:45 UTC and 13:30 UTC.
In animations, the atmospheric changes over mid-latitudes in the Northern Hemisphere may appear smoother because the satellite scans it every 30 minutes compared to every few hours elsewhere – this exceptional observation frequency feeds weather models, enabling more timely forecast updates.
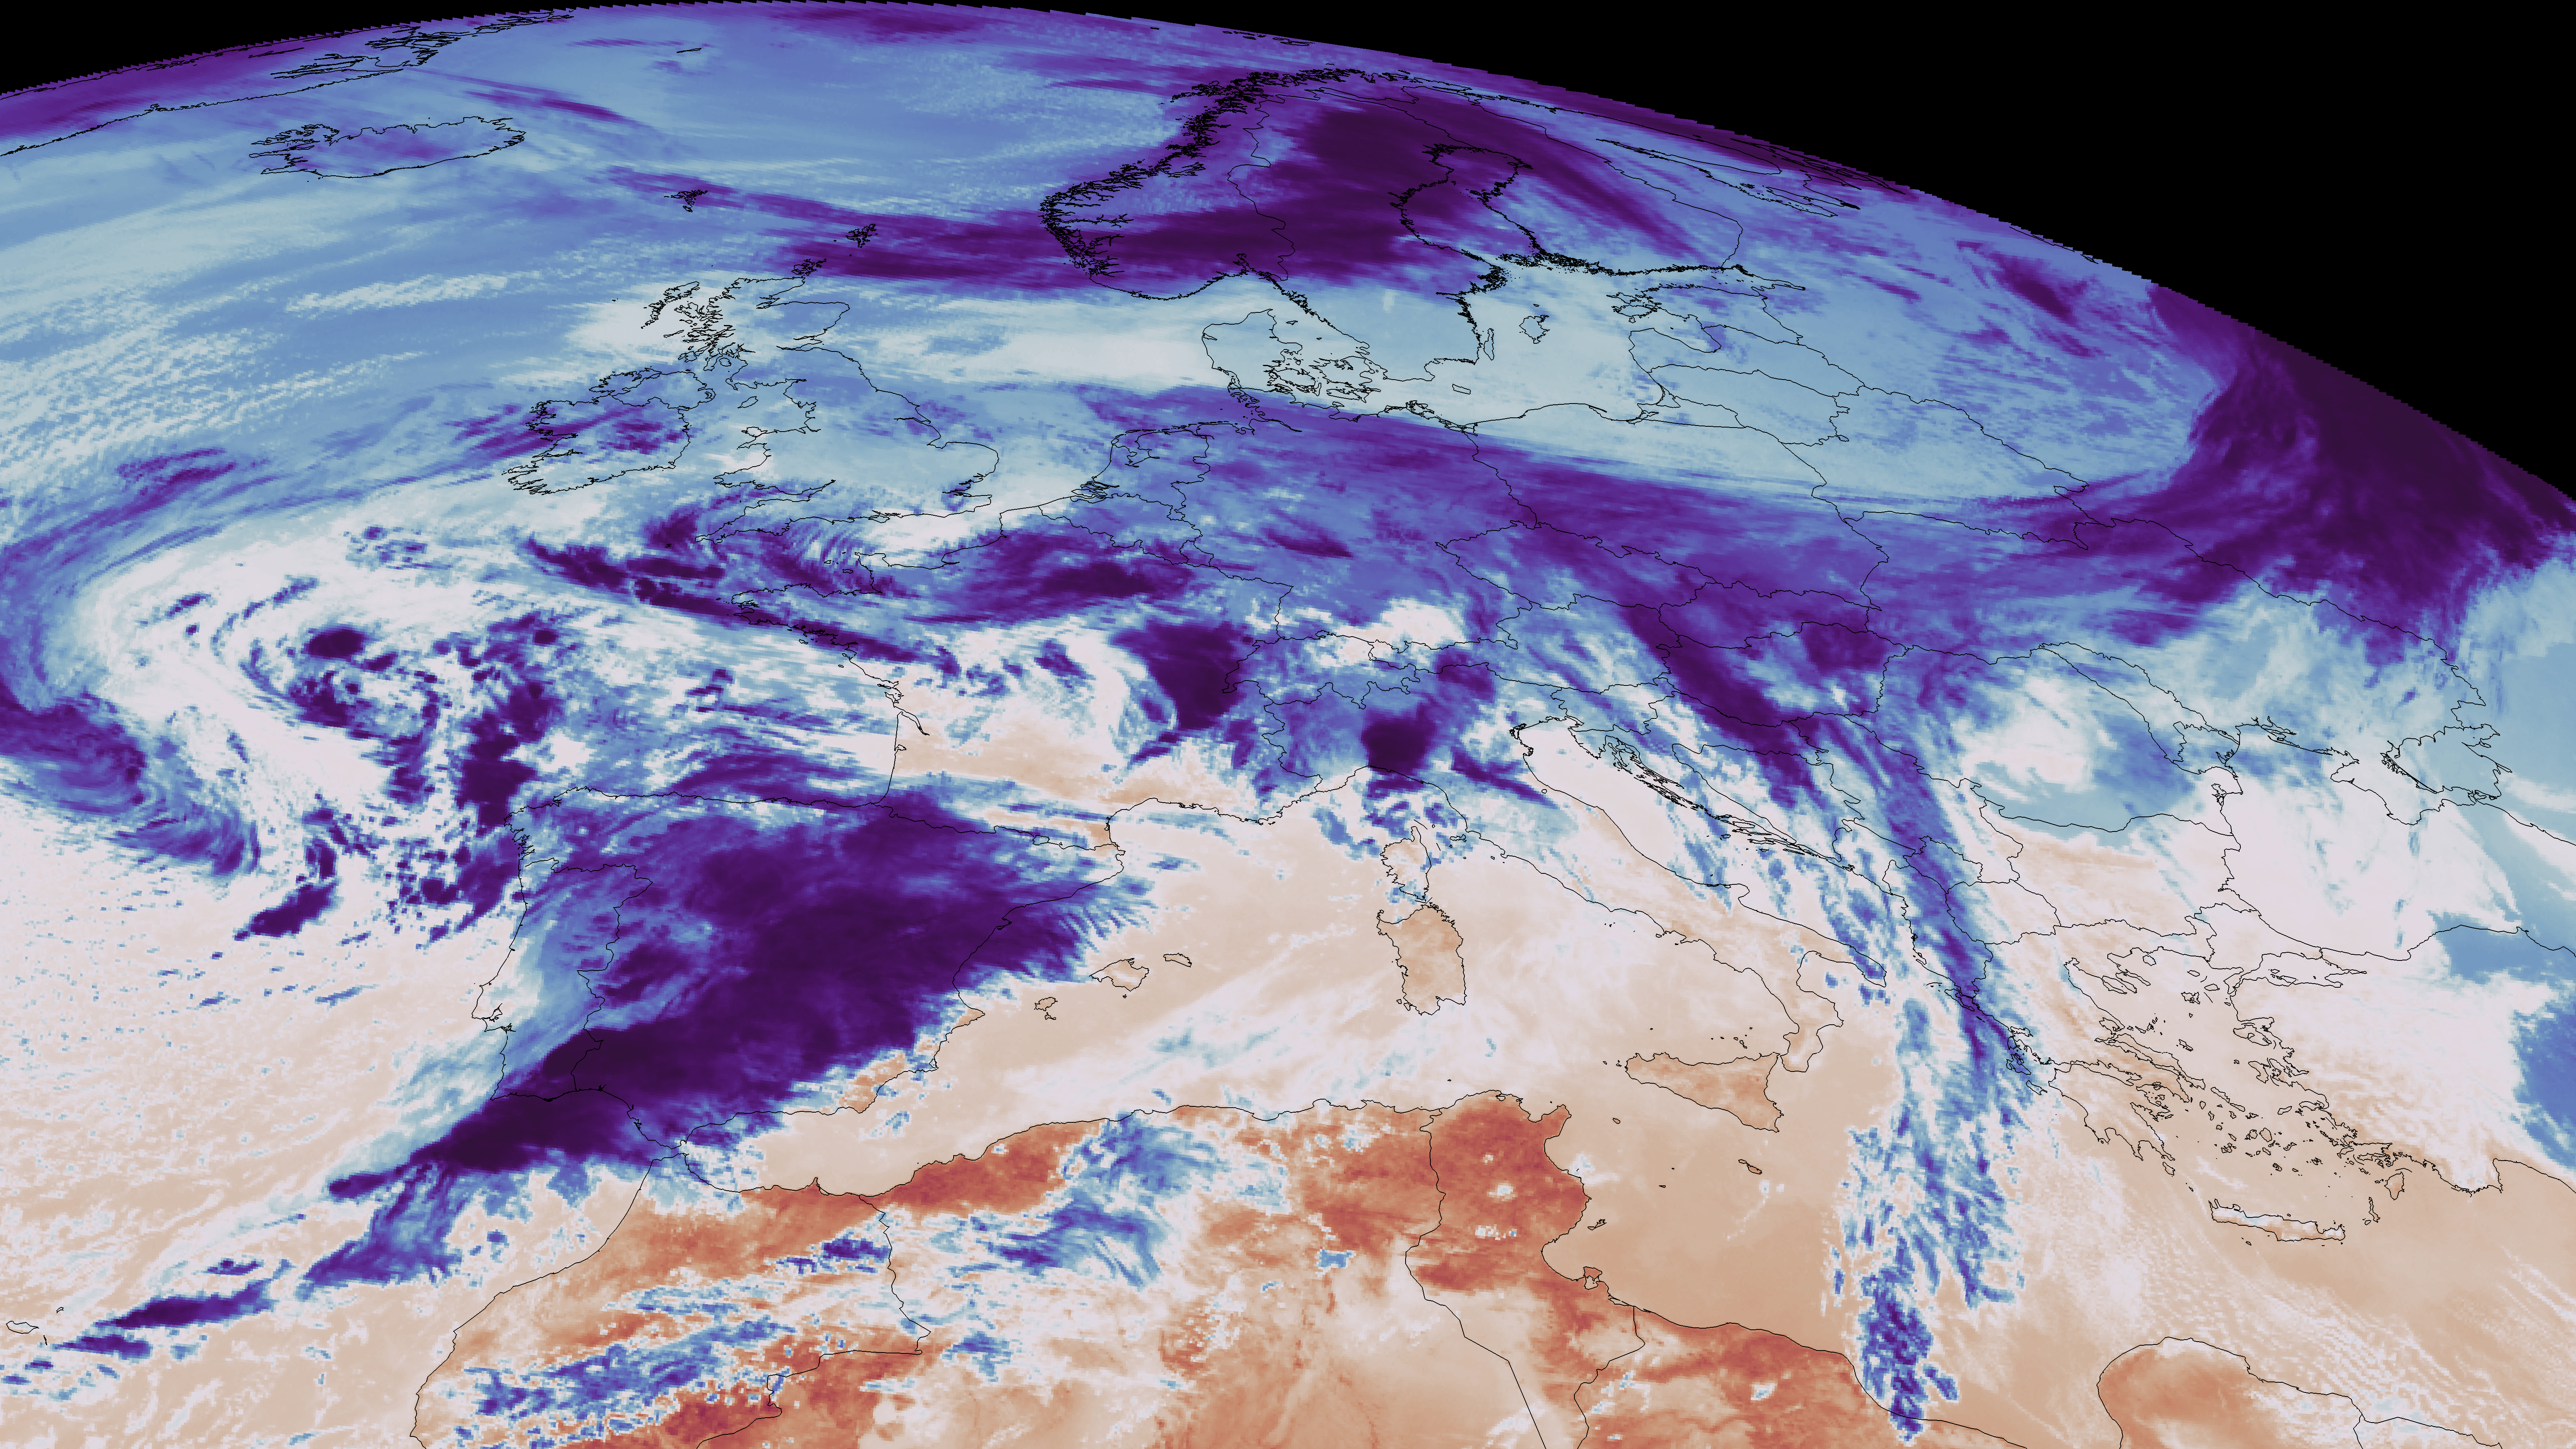
Storm system over Europe
A close-up of Europe in long-wave infrared shows clouds associated with Storm Claudia blanketing much of Europe. Blue shades depict clouds from the frontal system stretching from the Iberian Peninsula towards Central Europe, connected to the low-pressure centre over the Northwest Atlantic. Clouds with very cold tops appear in darker blues, indicating intense storm activity. The hottest areas are shown in red, with the land surface of the Sahara Desert dominating the southern edge of the view.
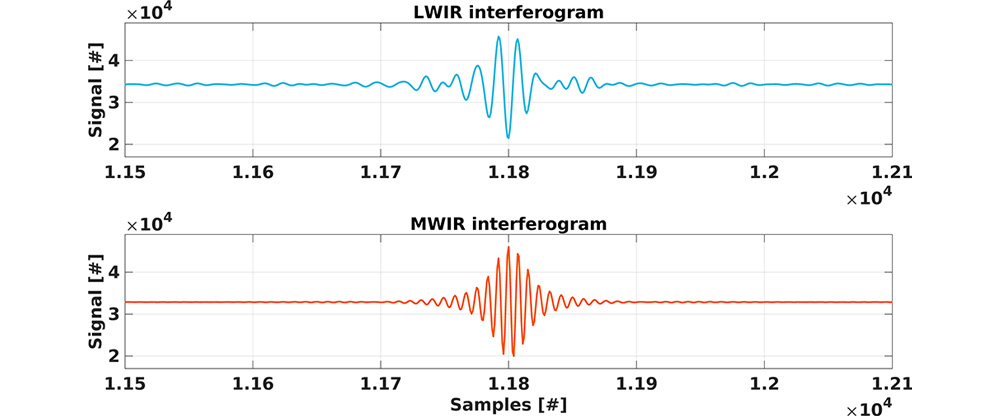
First observations
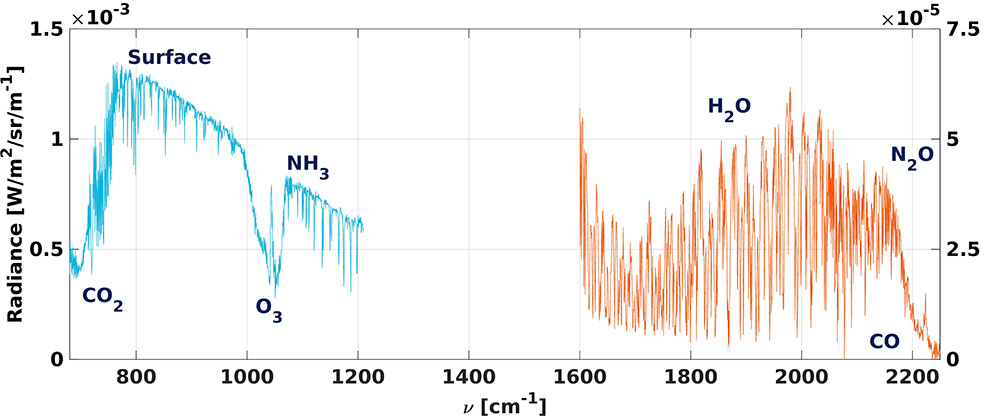
While the first images were captured on 15 November 2025, the steps ensuring their delivery began months earlier. On 8 September 2025, the Infrared Sounder made its first successful observation of an internal calibration target, confirming the instrument was ready for the next commissioning stages. Rather than measuring each wavelength directly, the instrument works like the interferometers many learn about in school physics – it combines incoming light waves to create a unique interference pattern known as an interferogram. Just as a prism splits white light into colours, this wavy pattern mathematically contains all 1,953 wavelength measurements at once and when processed reveal thermal emission and absorption signatures from water vapour, carbon dioxide, ozone, ammonia, carbon monoxide, and nitrous oxide – building blocks for understanding atmospheric structure and dynamics.

Sweeping through the spectrum
Sweeping through a selection of channels across the infrared spectrum reveals different features of the Earth's surface and atmosphere with each wavelength. Starting where carbon dioxide strongly absorbs radiation from high in the atmosphere, completely obscuring the surface, the view gradually clears. "Window" channels reveal surface features which sharpen into focus, cloud tops standing out clearly, and temperature patterns across continents. As the sweep continues, features like stratospheric ozone and water vapour bands appear, revealing moisture patterns while the surface becomes hidden. Each wavelength responds to various atmospheric components at different altitudes, constructing the three-dimensional profiles of temperature, water vapour and ozone that sounding instruments are built to deliver.
Inside every pixel
An interactive visualisation demonstrates the Infrared Sounder's hyperspectral capability. This observation – called a dwell, a single scan capturing one area – was acquired near the limb, Earth's edge as seen from the satellite. Each point (i.e. pixel) in the image contains a complete spectral signature: 1,953 channels capturing how the surface and atmosphere absorb and emit infrared radiation at different wavelengths. Every single pixel contains not just one measurement, but an entire spectrum of information about temperature, moisture, and atmospheric composition at that location.

Volcanic eruption tracking
An animation tracks the eruption of Ethiopia's Hayli Gubbi volcano on 23 November 2025. Background imagery shows surface temperature changes while infrared channels highlight the developing ash plume. By combining multiple wavelengths, scientists can separate volcanic ash from sulphur dioxide, with the latter shown in blue to red shades – potentially providing critical information for aviation safety. The satellite's timely observations enable tracking of the evolving ash plume over time.
Forecast-ready data
In order to disseminate the vast amount of data produced by Infrared Sounder, its measurements are compressed into principal components. The animations show such products, unlocking atmospheric details invisible when viewing any single wavelength alone – revealing thin cirrus clouds and dust, distinguishing ice from water clouds and identifying severe weather signatures. Users of the data can decompress these products to recover the full spectral radiances when needed.
Data processed in collaboration with industrial partners Thales and OHB, under the supervision of EUMETSAT and ESA. The visuals and animations have been produced by EUMETSAT.