Smoke from exceptional California wildfires reaches Europe
Satellite observations monitor the transport of emissions.

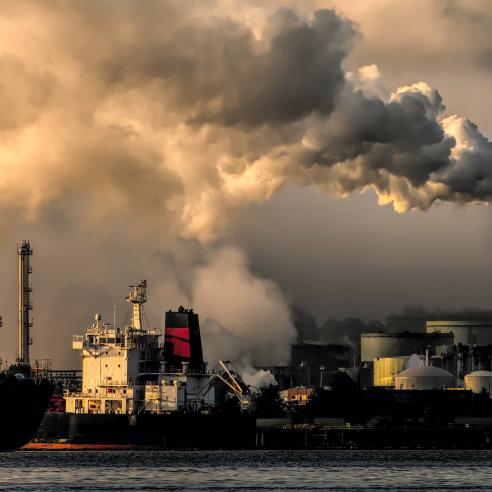
The fires wreaking havoc in California have produced massive amounts of smoke, causing some areas to be lined with falling ash and transforming the normal light of day into eerie orange skies.
01 November 2023
23 September 2020

It might be surprising to know that the smoke has even made its way as far as Europe.
Federico Fierli, Atmospheric Composition expert at EUMETSAT said:
"Each year, we observe extensive and prolonged wildfires in many regions and California is known to be one of the most affected. However, this year appears to be exceptional, as preliminary data has shown it is estimated to be a record in terms of extent and fire emissions."
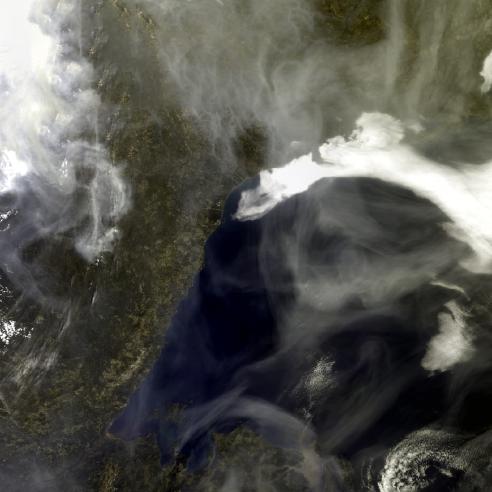
Last week was characterised by an even higher intensity of fires as documented by NASA satellite observations, who reported a rare Pyrocumulonibus cloud developing in southern California from 6 September (see Fig.2).
These types of clouds are comparable to convective towers and are generated by fire at high temperatures. They are usually more likely to appear at northern latitudes (e.g. Canada or Siberia) where the atmosphere is colder.
The clouds release the fire’s emissions (such as gas and particles) at a higher altitude, thanks to the intense uplift amplifying the impact the fire has on the composition of the atmosphere.

Vertical uplift plays a role in spreading fire emissions over longer distances, due to the fact that horizontal transport is more efficient at a higher altitude in the atmosphere because of stronger winds and therefore, removal of these products is less efficient.
Monitoring the smoke’s reach
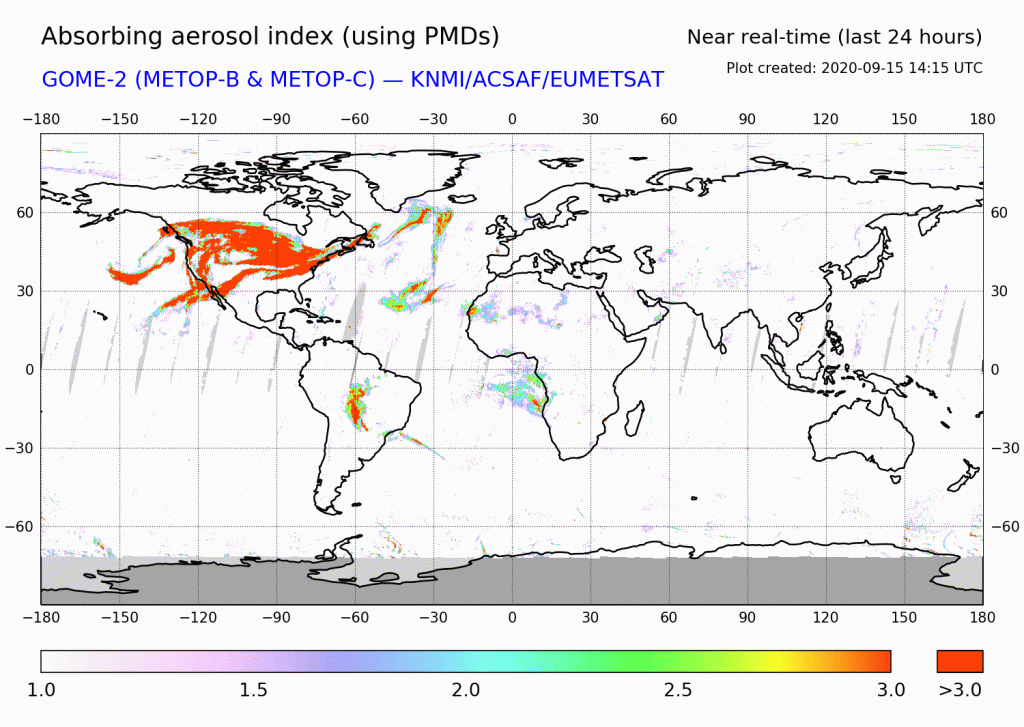
The long-range transport of emissions can be observed by satellites and the carbon monoxide (CO) that is produced by combustion stays in the atmosphere for weeks, making it easier for us to track. In this next example, a burst of CO is visible over southern California from 7 September during the most intense phase of the fires, generating a vast plume of smoke that has been spread by atmospheric winds across the Atlantic Ocean.
Cathy Clerbaux, Senior Scientist at LATMOS/CNRS said:
"CO is a very good tracer of combustion. Since the launch of the IASI instrument in 2006, it is the first time that we’ve seen such a clear, massive CO plume travelling across the ocean and reaching Europe."

The transport of plumes over Europe is also due to the exceptional amount of CO released into the atmosphere, much larger than other regions where active wildfires are also intense emitters. Federico added:
"Wildfires contribute substantially to the global budget of atmospheric carbon, which also includes CO2. Satellite data tells us that the carbon monoxide observed over the west of California has tropospheric concentrations that are four times higher than those recorded in Amazonia and Central Africa, known to be the highest emissive regions. These appear as red plumes over the Western Pacific."