Thar she blows - Polarstern blog number five
Blog number five has landed and this week's hot topic is wind!

It's the fourth week aboard the Polarstern and so far we've been given plenty of insight into the kinds of weather phenomena the vessel has passed through on its exciting journey towards Cape Town.
09 August 2021
14 December 2018
This week, the students are filling us in on the wind-types encountered along the Polarstern's path since last time, delving into the semi-tropical, high-pressure zone and the capabilities of satellite observations for clouds and precipitation.
Blog five: Week four on the ship
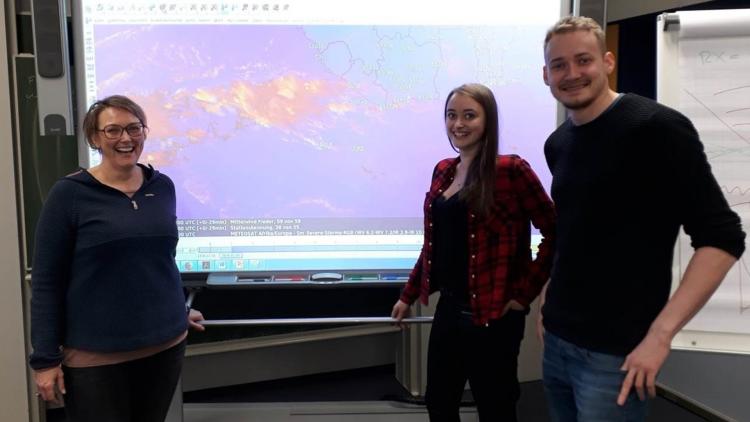
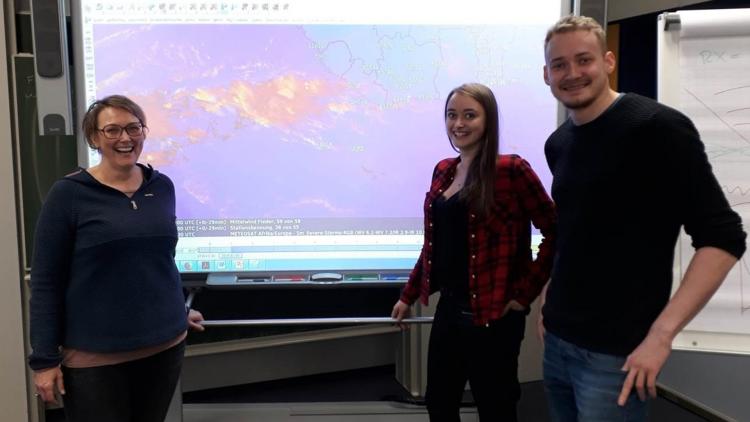
Authors: Benjamin Martius, Paul Wachsmuth, Tobias Voll

The ship has continued its southward direction towards Cape Town. From the equator, it passed the Gulf of Guinea at approximately 1400 kilometres to the west of Namibia.

Along its journey, the Polarstern crossed the semi-tropical high-pressure zone. The semi-tropical high-pressure zone is a zone within the subtropics, located between Hadley-cell and Ferrell-cell. There is high pressure here due to the air descending - the warm, humid air in the ITCZ (see last week's blog for more info on the ITCZ) rises up and cools down with increasing height. At this increased height, the air is transported by the anti-trade winds (these winds counteract against the trade winds) to the north or the south.
The air then descends to the ground at higher altitudes again. This results in the subtropical high-pressure zone and is most prominent between 20° or 40° north and south.

The prevailing wind in the zone between the high-pressure belt and the equator is the south-east trade wind in the Southern Hemisphere. This very strong wind blows from the semi-tropical high-pressure zone to the equator.

Source: EUMeTrain - ePort.
Now we'll take a look at the south-east trade wind in more detail. In the image shown above, you can see the prevailing wind on the Polarstern's position from 30 November. This frame was recorded with the help of the Advanced SCATterometer (ASCAT) instrument on board the Metop satellites.
Why does the trade wind direction in the southern hemisphere move south-east?
Air from the subtropical high-pressure belt moves towards the low pressure of the ITCZ. Due to the Earth's rotation and the resulting Coriolis force, the winds are deflected westwards which leads to the formation of the south-east trade wind.

The ASCAT plot above shows a wind direction of 138° at a speed of approximately 15 knots. At approximately the same time (12:00 UTC) the measurements taken on board the Polarstern show a wind direction of 140° at approximately 18 knots.
As you can see, the measurements taken from the Polarstern and the data delivered from the ASCAT instrument on board Metop are almost the same. This is due to the fact that the ASCAT instruments can derive wind vectors over the ocean surface with a C-band radar. Below, you can see this weather report also taken from the vessel on 30 November 2018 at 12:00 UTC, showing a very significant cloud report.
The group of numbers (circled) describe the clouds in more detail. The first figure 8 stands for the group number, the second 8 gives the degree of coverage (this is measured in eighths and is determined by eye). The third 8 provides us with the cloud type and tells us that the observed clouds are within a deep-cloud level, so from 0 to 2000m in height.
So, we can see from this information that the observed clouds are cumulus and stratocumulus, both with different heights but within the deep-cloud level.

Above you can see an image taken from the webcam aboard the Polarstern showing the two cloud layers. We selected the image taken at 17:00 UTC, where you can see these two cloud layers very clearly.
Finally, we come to the last topic of this blog entry and will touch upon typical clouds in the subtropical high.

The Day Microphysics is an RGB image, based upon the colours red, green and blue. The primary aim of the Day Microphysics is to provide a complex cloud analysis, to distinguish ice from water and to provide information on cloud-top particle size, temperature and cloud optical thickness.
Further analysis are to monitor the development of convection, fog and low clouds. It can only be used during the daytime and it has restrictions in winter for higher latitudes. It provides a complex cloud analysis, merging cloud thickness with cloud top temperature and microphysical (phase and particle size) information.
It is also possible to monitor the phases/processes of developing convection on the Day Microphysics RGB animations. However, it has both benefits and limitations. The benefits of this RGB picture are the good contrast between ice and water clouds, especially for water clouds with small droplets. It also provides information on cloud particle size. Furthermore, it displays a good colour contrast between water clouds with small droplets and snow on the ground. A further important benefit in our opinion is that it is able to detect wildfires.
The limitations are the daytime-only availability - this is due to the pixel colour fading during dawn/dusk when the Sun's angle is low. The proper interpretation of all colour shades requires a lot of practice.

The vessel is surrounded by violet clouds in the RGB Day Microphysics image above. The violet colour stands for thick water clouds, with large droplets and the possibility of warm precipitation.
The Polarstern has almost finished its trip and we have also come to the end of our entry. We would like to say goodbye to the readers and hope that you have enjoyed our explanations on the exciting weather phenomena, and that you have also learnt something about our topics.
Well, we've certainly enjoyed reading them at EUMETSAT! There's just one more entry to come on the Polarstern's journey and we'll deliver that to you next week... until then, why not keep yourself busy with the previous blog entries, found on our Science Blog.