An update on the Polarstern's progress
It’s the second week aboard the Polarstern and the third blog post recording the adventure!


This week's post will discuss the importance of different measurements for the study of the atmosphere, with plenty of illustrations to demonstrate the findings.
19 May 2022
03 December 2018
Picking up where the last group left off, here's...
Blog three
Week two on board the vessel
Authors: Joris Breuer, Kalifa Diarra and Tom Gericke

"The ship has been travelling from the Bay of Biscay and moving along the Portuguese coast towards the Canary Islands. On 18 November, the Polarstern had its first stop in Las Palmas (Gran Canaria), where most of the scientists already on board left the ship and six new scientists joined the crew. The Polarstern will stay in Las Palmas for three days to undergo a 3D photo and laser recording of the ship’s interior.
Las Palmas is one of the largest cities on the Canary Islands, home to approximately 383,000 inhabitants. It also has one of the largest ports in the Atlantic."


"Now we will go into some detail regarding the weather situation on 17 November throughout the Polarstern's path, as recorded by the measurements on board, the view from our webcam and the view from the geostationary satellite Meteosat.
At 12:00 UTC the Polarstern was cruising along the open Atlantic, south of Madeira and about 300 kilometres away from its stopover in Las Palmas."

"The surface weather chart above displays the passage of a cold front north of the Canary Islands over the Atlantic, passing by the Polarstern. This ties in with the surface synoptic observations (SYNOP) taken on board the Polarstern, which measured light rain due to the upslope effect of the nimbostratus-type cloud. Below, you can see the ship's SYNOP message at 12:00 UTC on 17 November."
DBLK 17 12 1 99313 70143 11397 72509 10181 20158 40074 50013 6///1 761 62 8472 /22242 04207 20503 32529 40904 51003 6////
"Group 7 within the SYNOP message represents the current weather condition. The number 61 stands for light rain without interruption. Group 8 stands for the current cloud conditions. The digit 4 stands for the degree of cloudiness of the lower cloud layers expressed in eighths, giving us a coverage of 4/8. The numbers 7 and 2 indicate the cloud types. This message tells us we have cumulus fractus (or stratus fractus) and nimbostratus.
The below record shows the typical veering of the wind direction, here from 180° (south) to 250° (nearly west)."

"Now, let's take a look at the nimbostratus clouds from above (via satellite) and below (webcam) at 09:00 UTC, 12:00 UTC and at 15:00 UTC.
At 09:00 UTC we can see the Polarstern is in the midst of continuous rain. The webcam image on the right shows the nimbostratus and below it, the stratus fractus clouds. The cyan colour in the Natural Colour RGB image on the left represents ice crystals at the top of the clouds."

"At 12:00 UTC, the cloud situation is similar to 09:00 UTC. At this time, the cold front passes the vessel."

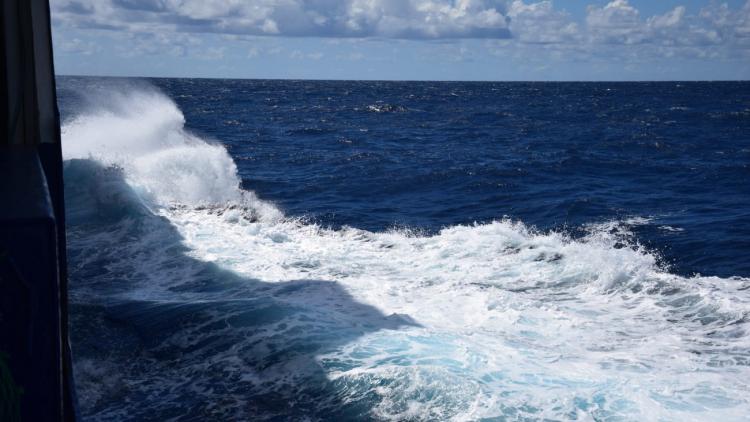
"At 15:00 UTC, the Polarstern reaches the rear side of the cold front. The webcam shows a typical decreasing cloud cover with sunny intervals. The satellite image shows the end of the cloud band with more and more cloud-free areas displayed in black."

"In the image below, you can see an Airmass RGB gathered from EUMeTrain (ePort) on 17 November 2018 at 12:00 UTC. The Airmass RGB helps to distinguish polar from tropical air masses and high reaching, multi-layered clouds. It also helps to analyse dynamic processes in the atmosphere. Very important for the location of the jet stream is the border between the colour blue/green and red. The reddish colour in area five helps us distinguish dry, descending stratospheric air with a potential cyclogenesis."

17 Nov 2018, 12:00 UTC, Airmass RGB
"Take a look below at the radiosonde measurements taken in Funchal (Madeira) and you will find these conditions relate to a moist lower troposphere and a dry upper troposphere. You will also find the jet with the highest wind speed is at 9800 metres. The transversal bands in area six are always an indication of potential Clear Air Turbulence (CAT) in aviation."

"Now, we'd like to provide an overview of the climate conditions experienced during the trip, that were dominated by a Mediterranean climate.
The Mediterranean climate is a subtropical macroclimate with dry, hot summers and rainy, mild winters. According to Köppen and Geiger's effective climate classification: the Mediterranean climate is defined by an annual total precipitation of over 400mm to a maximum of 1000mm with humid winter months and arid summer months and a maximum precipitation below 40mm. The annual mean temperature is above 14°C. The subtropics lie in the latitude between the temperate zone (see the first logbook) and the tropical zone. In the Northern Hemisphere, the subtropical zone extends mainly over southern Europe, southern Asia, the southern part of North America and North Africa."

"The climate in the subtropical zone is characterised in particular by the fact that tropical climatic conditions prevail in summer, while the climatic conditions in winter are more reminiscent of the temperate zone. Subtropics are defined as regions where the annual average temperature is above 20°C, but the coldest month has an average temperature of less than 20°C.
The subtropical zone can be divided into three areas with different climate conditions. In the dry subtropics, the climate is arid and the growing season is usually no more than six months. In the winter-moist subtropics, however, the growing season is up to 10 months. Only in summer is the climate arid. The climate in the humid subtropics is very similar to that of a tropical rainforest, with vegetation growing all year round. Since the Polarstern stopped in Las Palmas for a few days, we will explain a little about the local climate conditions there.
The Atlantic has a big influence on the climate of Las Palmas – where a marine climate reigns. This means that during the winter, the ocean significantly heats the air near the coast. In contrast, the air is cooled down in the summer months from the sea. Accordingly, the winter months in Las Palmas are extremely mild and the summers warm but not too hot. The average temperature does not change significantly over the year.
In January, the coldest month of the year, the average temperature is around 18°C. In August, the warmest month, it can boast average temperatures of 25°C. The largest amount of rainfall takes place in December. In contrast, the months of June, July and August are the ones with the lowest precipitation. The climate on the Canary Islands is further influenced by the trade winds. The rising of these winds on the northern slopes can lead to precipitation. It is often cloudy in Las Palmas and this climatic phenomenon is referred to by locals as the 'donkey's belly'"


"A passat is a moderately strong and very stable wind that occurs in-between the tropics at about 30° latitude around the globe. There are two passat winds with different main wind directions (north-east passat in the northern hemisphere, south-east passat in the southern hemisphere). The passat may have different characteristics depending on the nature of the swept earth surface.
If it blows over water surfaces, it can absorb a lot of moisture and brings, as a local wind, high rainfall to the coasts. However, if it sweeps over large land masses, its moisture content remains very low and it causes a dry climate. Between the passat zones lies the Intertropical Convergence Zone (ITC or ITCZ), a predominantly windless zone due to the vertically ascending air masses (further information on this next week in blog post four)"

"The trade winds are formed by air flows in the Hadley cell which move from the 30° N/S high pressure belt towards the equator. Under the effect of the Coriolis force, the wind is deflected to the right (on the northern hemisphere). Therefore, the trade winds have a north-eastern direction on the northern hemisphere."

"In the picture from the ePort portal above you can see the Polarstern in the open Atlantic on the way towards the Canary Islands. The figure shows the wind arrows and thus the respective direction and strength of the wind. In the lower left part of the picture we have a clear north-east current of the wind, typical of the north-east passat. The low pressure areas to the east and west as well as the cold front change the wind flow, which is clearly visible around the Canary Islands. This is why the measured wind direction on board (see figure 4) deviates from the characteristic wind directions of the trade winds on that day."
Next week the Polarstern is set to reach its final destination of Cape Town, South Africa, so make sure you tune in for the next chapter!
Useful links:
For further information on the RGB images and their composition: technical documents.
These two training modules for RGB images via EUMeTrain are also recommended: Operational use of RGBs: Part 1 (with the Airmass RGB) http://www.eumetrain.org/resources/operational_use_rgb.html
Operational use of RGBs: Part 2 http://www.eumetrain.org/resources/operational_use_rgb2.html