

27 January 2023
25 August 2021
From early 2023, the Meteosat Third Generation Imager (MTG-I) mission will operate the Lightning Imager (LI) from geostationary orbit. LI is an imager designed to capture the optical signal radiated by lightning pulses, with observations of the Earth in the 777.4nm band at 1,000 frames per second. The Field of View (FOV) of LI will cover Europe, the Mediterranean Sea, Africa, the Atlantic Ocean and part of South America.
A critical part of the LI commissioning and cal/val activities is the comparison of LI measurements against lightning detections from ground-based lightning location systems (LLSs) and space-borne optical instruments (e.g, the GOES-R Geostationary Lightning Mapper (GLM)).
Typical ground-based LLSs can provide users with the time and location of most cloud-to-ground lightning, and some cloud lightning. The lightning mapping array (LMA) is a ground-based precision system that maps in 3D the very high frequency (VHF) radiation emitted by lightning, within a range of few hundred kilometres — offering a unique temporal and spatial description of the lightning activity. Thanks to their remarkable detection capability, LMAs are particularly suitable for the assessment of lightning detection performances, providing reference data that are very close to the so-called 'truth', i.e. the complete lightning activity. For this reason, they have been widely used in different cal/val activities of both ground-based LLSs and space-borne optical detectors.
So far, there has been no LMA cal/val campaign in Africa. Africa is attractive for LI cal/val activities as it features significant year-round lightning activity and is located near the sub-satellite point of MTG-I, where the highest lightning detection efficiency of the LI is expected.
Objectives
The study will answer the following questions:
- Which dedicated LMA campaigns have been, or are being, run? What are their key characteristics and results? The answer should have particular emphasis on those campaigns that provided data for comparisons against space-borne lightning optical imagers.
- What type of dedicated campaign(s) could be performed by relocating the European LMA networks as we know them today? The intellectual/human resources involved also need to be considered.
- What are the best sites over African territory to run a dedicated LMA campaign? What is the lightning activity at such sites?
- What are the possible examples of dedicated campaigns that EUMETSAT could consider running after the launch of LI?
Overview
In order to answer to the questions listed in the objectives, the following tasks were undertaken:
Task 1: Heritage from other dedicated LMA campaigns
In this task, two main activities have been conducted:
- A literature review of the LMA-based field campaigns that were conducted in support to the Lightning Imaging Sensor (LIS) and Geostationary Lightning Mapper (GLM) cal/val activities.
- A survey with the participation of the worldwide LMA community to gather their experience in LMA field deployment. The outcome of the survey was documented.
Section 3.2 of the final report provides a detailed overview of previous LMA campaigns.
Task 2: European LMA networks for dedicated campaigns
A preliminary assessment of the potential of the Consortium of European LMA networks (in their current configuration) has been conducted. This was based on the information found in the literature, and the answers to the consortium survey. Consortium members have successively demonstrated their capability to run LMA networks from their bases (Corsica in France, and Ebro Delta in Spain) and remotely (e.g. Colombia). The observations of the two LMA networks have already contributed to the cal/val activities of space-borne lightning detectors including ISS-LIS and GLM.
Section 3.3 of the final report provides a detailed overview of the potential of European LMA networks for a dedicated campaign in Africa.
Task 3: Best sites in Africa and their observational properties
This task aims to examine storm climatology, in terms of location, seasonal variation, and severity over Africa, to identify potential sites for the deployment of LMA stations in support to MTG-LI cal/val activities.
Seasonal and diurnal cycles of convection were investigated to derive optimal field campaign properties, including best candidate locations, campaign duration and period during the year.
Two approaches were followed for providing a series of macroscopic storm characteristics, such as month(s) and hour(s) of the maximum storm activity:
- Using the cloud brightness temperature. Ten years (2011–2020) of Meteosat Second Generation (MSG) Spinning Enhanced Visible and InfraRed Imager (SEVIRI) 10.8μm brightness temperature data, with 15-minute time resolution, have been processed to derive the convection properties over Africa.
- Using lightning observations. Tropical Rainfall Measuring Mission (TRMM) Lightning Imaging Sensor (LIS) 0.1 degree Very High Resolution Gridded Climatology data collection has been used to refine monthly and diurnal thunderstorm cycles, for the period 1998–2013.
Predominant occurrence of the convection over land and seasonal movement of the storm activity between the northern and southern hemisphere are demonstrated (Figure 1). Thunderstorm activity is evenly distributed over the year near the equator. The northern Sahel sees activity from May to September, with deep minima in other months. In continental southern Africa the trend is the opposite, with a strong peak from November to February.

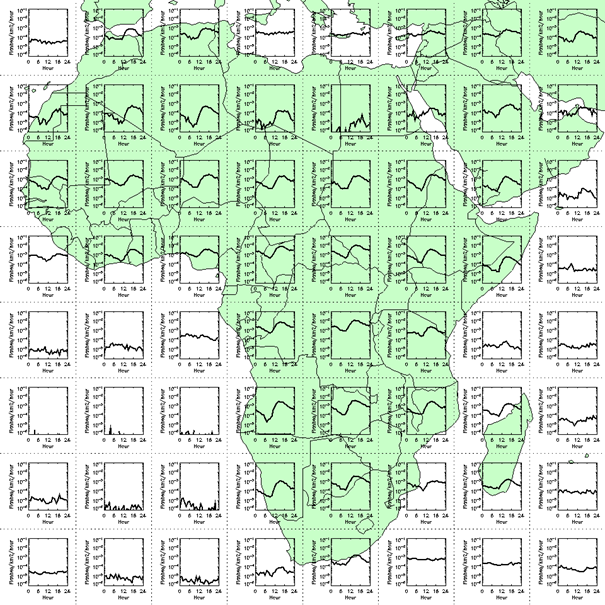
A typical diurnal cycle, with a peak in the afternoon and a minimum in the early morning, is present in the entire continent (Figure 2). The convective systems typically start developing at midday, and reach their maximum vertical development during the local afternoon. Equatorial Africa features the highest afternoon peak and is, also, characterised by relatively high nocturnal lightning activity.
The general overview of lightning activity in Africa is followed by a more detailed analysis of three specific regions of interest, proposed by EUMETSAT: Kenya/Uganda/Lake Victoria, Côte d’Ivoire, and South Africa. All these regions have national weather services that have on-going cooperation with EUMETSAT.
The Kenya/Uganda/Lake Victoria region is characterised by very strong lightning activity. Côte d’Ivoire has slightly weaker lightning activity than Lake Victoria, but it is located almost exactly at the sub-satellite point of MTG-I. South Africa is located at almost the edge of the LI FOV, however, its lightning activity is very strong, and it hosts a state-of-the-art ground-based VLF lightning location network (SALDN) operated by the South Africa NWS.
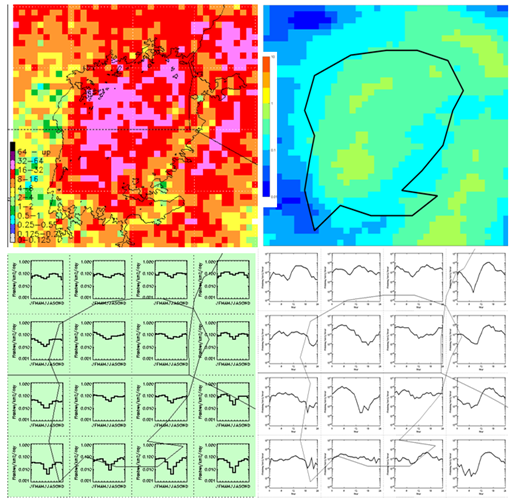
Specific local features of convection and lightning activity are presented. For example, in the Lake Victoria region, convection occurs mainly over land during the afternoon, but during the second part of the night to the early morning over the lake itself (Figure 3).
For each region, a detailed analysis, including the periods of convection and potential areas for LMA deployment, are presented. More information can be found in Section 3.4 of the final report.
Task 4: Possible dedicated LMA campaign for LI commissioning and cal/val
This task provides nine examples of dedicated campaigns (three in the Lake Victoria region, three in Côte d’Ivoire, and three in South Africa). Each example considers the different aspects of running a LMA campaign in the particular area, including the incidence of lightning, potential host institutions, logistics, estimated coverage of the LMA, etc. Science and LI cal/val based rating is also provided for each of the nine potential LMA locations. In addition, an example timeline of a LMA campaign in Africa is provided.
Section 3.5 of the final report has full details.
