The Polarstern logbook
What's on board the vessel and what was seen during the first days of the virtual mission to Cape Town from Bremerhaven.


This second blog post covers the period 11-14 November and goes into more detail about the different climate zones the ship passed through.
19 May 2022
20 November 2018
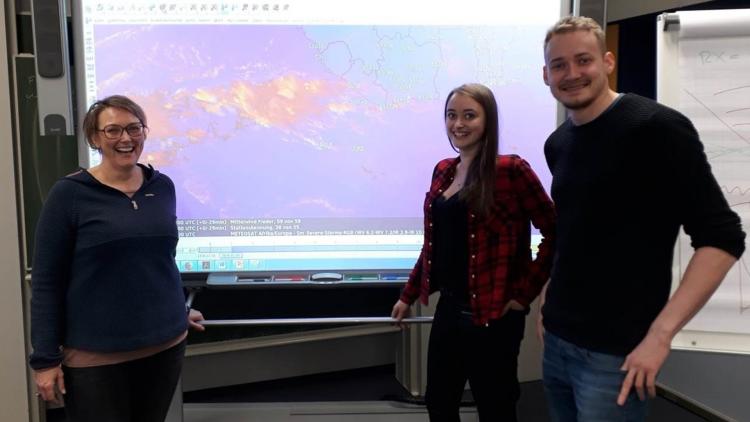
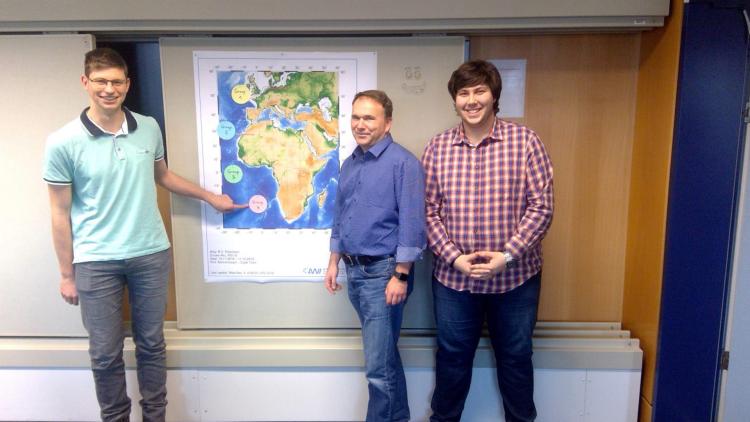
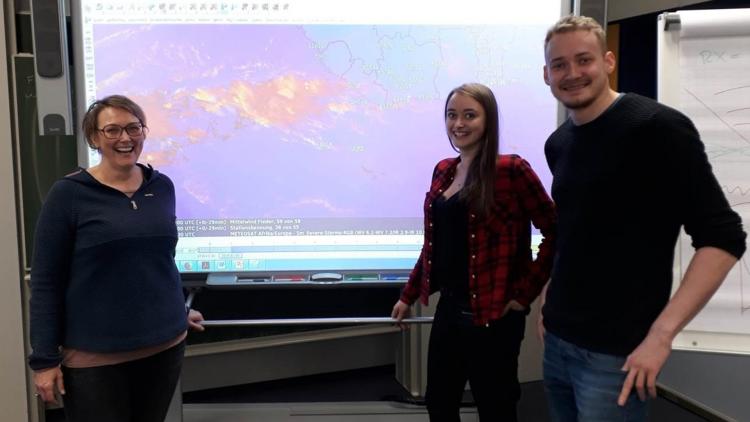
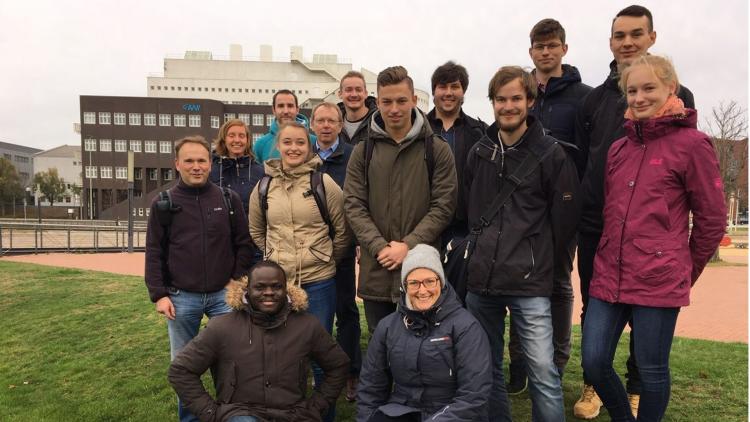
The students from group FH38 are reporting from the Meteorological Training Centre of Deutscher Wetterdienst (DWD) in Langen.
Blog two The first days aboard the Polarstern
Authors: Anna-Sophia Kannenberg, Felix Möller and Lucas Wankerl

This week marks the start of our blog about the journey of the German polar research ship Polarstern from Bremerhaven over Cape Town to Antarctica.
Actually, the Polarstern should have taken off on Saturday, however some small delays involving the upkeep of the ship meant that the schedule was postponed by one day to Sunday, 11 November. On board there are 50 scientists from 17 different international institutions, the leading institution being the Alfred Wegener Institute (AWI) for polar and maritime research. The aim of the mission is to gain information about sea ice and the marine biology under the sea ice. Furthermore, the ocean floor will be measured.
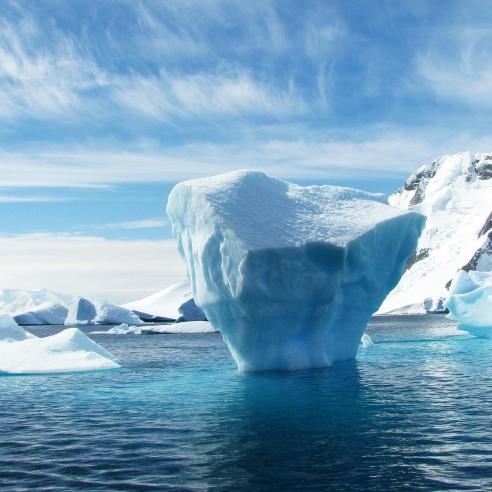
Besides this, the Polarstern is going to supply the Neumayer III station with new resources. Therefore, the journey will cover some significant locations, one of which is the Weddell Sea and, if sea-ice conditions allow it, the Polarstern will arrive at the Larsen ice shelf-C. In May 2019 the Polarstern is due to set off for an expedition to the South Shetland Islands and return afterwards to Bremerhaven.
There are also two weather specialists on-board from DWD and a webcam for us, so that we are able to observe the weather from our academy in Langen (Hesse). Our task is to follow the daily journey of the Polarstern in order to record any significant weather phenomena and other meteorological events, e.g. the different climate zones the ship will be crossing. During the first few days the ship will remain in the temperate climate zone. This is going to be explained in the following sections.

The temperate zone is located between the subpolar and subtropical zones. It is a climatic zone characterised by a clear seasonal change with different temperatures and precipitation. The temperate zone can be subdivided into a warm and cold temperate. The climate ranges from mild marine climate, which involves low temperature fluctuations and large amounts of precipitation, to the continental climate, which sees high temperature fluctuations and relative drought. By definition, all areas belong to the temperate zone, where the warmest month reaches a mean temperature of at least 10°C and in which the average annual temperature does not exceed 20°C. The climate is characterised by the westerlies. The temperate zone carries temperatures of over 30°C that fall below 0°C in the winter.

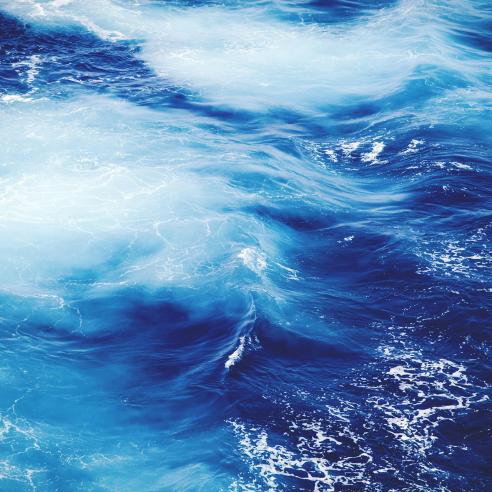
Ocean currents are defined as stable, horizontal and vertical movements of water masses in the oceans. The causes of sea currents are wind, temperature differences and salinity in the ocean. Due to the ocean's ability to store, transport and exchange heat in the atmosphere, ocean currents have a significant impact on the climate. They contribute to heat exchange between low and high latitudes and are essential for maintaining global heat balance. The most important current for Europe is the Gulf Stream. This warm ocean current affects our climate tremendously. The wealth of fish in the waters around Iceland and in the North Sea are partly dependent on it.

The westerly wind zone is one of the most important components of the atmospheric circulation. It is located between the subtropical high-pressure belt and about 60° wide of both hemispheres.
So how do the westerlies form?
Because of the subtropical high-pressure belt, the trade winds flow back to the equator and poleward air masses also flow out of the high-pressure belt. The Coriolis force causes the air masses flowing in the direction of the poles to be deflected so strongly in this area, that the original lines of longitude flows become westerly winds. This flow extends over the entire height of the troposphere.
A special feature of the westerlies is the jet stream. This wind arises along the polar front in the troposphere and reaches very high speeds. The polar front separates the cold polar air from the warm tropical air and is located where the largest horizontal temperature gradient prevails. This means, that the westerlies, which is the compensation flow between the tropical high and the polar low-pressure area, reach their highest speeds in the region of the largest temperature gradient. The horizontal temperature gradient is highest at the upper level of the tropopause, which is why the highest speeds of the jet streams are reached within the tropopause.
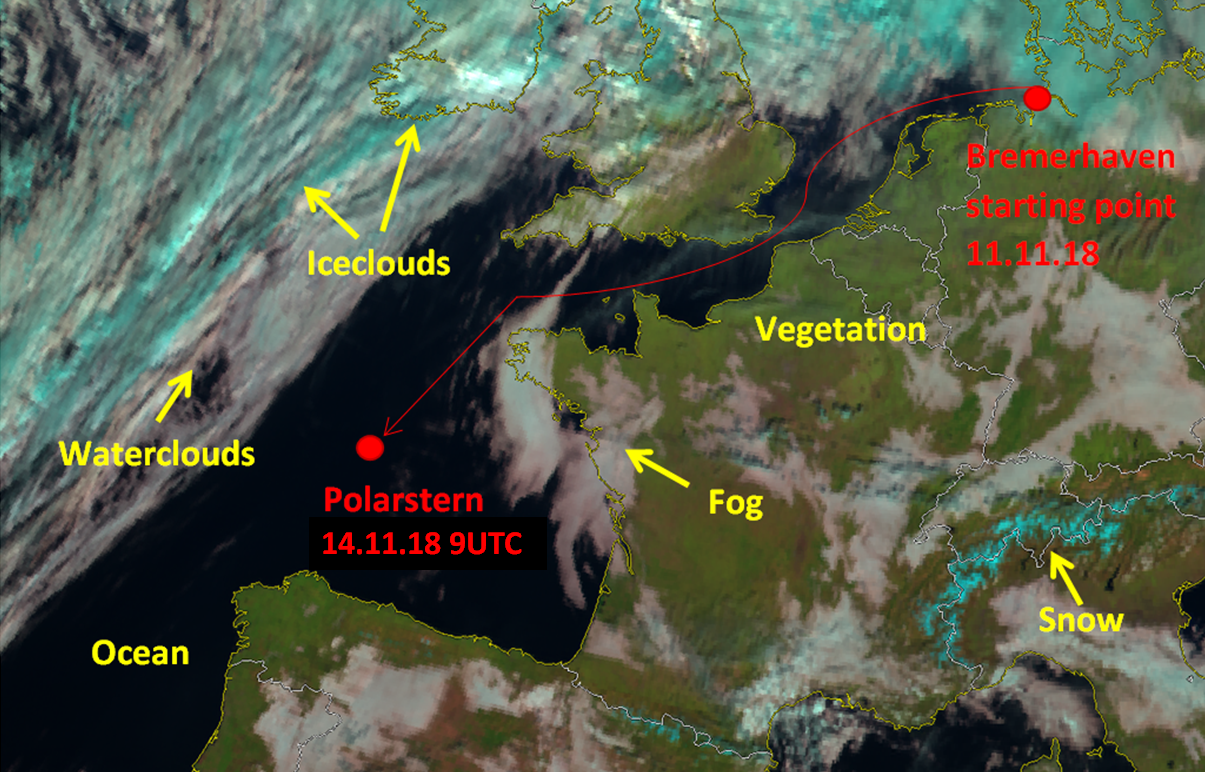
The jet streams form only a narrow band of a few 100 kilometres within the westerlies. RGB compositions are a very easy way to interpret satellite images without any tools. In such an analysis two to six satellite channels are combined, which are assigned to the basic colours Red, Green and Blue. As a result, from the painted colour on the monitor, the meteorologist is able to identify which properties the analysed surface (e.g. a cloud) has.
This colourful combination of different channels is a way to handle complex situations optically better than in a “normal” black and white satellite picture. In the natural-colour-RGB the near-infrared channel NIR1.6 (the number describes the wavelength in µm) is assigned to red. NIR1.6 can differentiate between ice/waterclouds and snow. The visual channels VIS0.8 (green) and VIS0.6 (blue) are provide information about the optical thickness of clouds and the channel VIS0.8 displays vegetation on the surface of the earth.
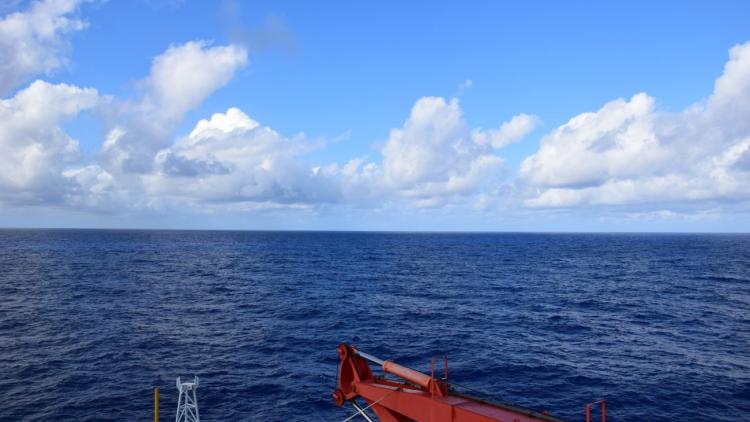
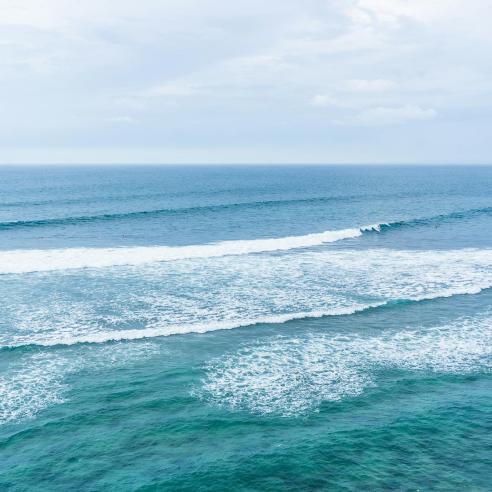
Regarding the weather, the Polarstern crossed paths with a rain shower on Monday 12 November. A picture of this special weather phenomenon, taken by the installed webcam, can be seen in the picture above. During this incident, the subpolar jet stream drifted right above the research vessel. Afterwards, no significant weather was reported. The temperature was moderate and the sea was calm. As you can see in the satellite picture, the following days the Polarstern had few clouds in its field of vision.


And that's it for week two! Next week, the Polarstern is set to reach the coast of Africa. This entry will include the next climate zone and the Gulf Stream as well as more information about the Airmass RGB.
Related links:
- Alfred-Wegener-Institute about the actual expedition
- Track and actual position of Polarstern from AWI
- EUMETView, a new way to visualise EUMETSAT satellite data (For the Natural Colour RGB click “RGB Composites” and “Natural Colour”)