RV Polarstern, 13 April 2017
Forecasting waves and wave height.


When performing maritime weather forecasts, especially for ship routing, you need to care about an additional parameter compared to forecasters that make predictions for land areas: the sea state or wave height.
11 March 2021
13 April 2017
Forecasting waves is a special subject and it's worth saying some words about it, especially as I mentioned terms like “wind sea” or “swell” for several times before, but without explaining the difference.
The waves we are talking about are totally wind driven (in contrast to waves that are geologically induced, which often end in tsunamis; but that is not our business) but they also give feedback about the wind field with a change of surface roughness.
Therefore knowledge about the sea state is also important for numerical weather forecasts, as it's one of its vertical constraints.
When the wind is flowing over the sea, energy is being transferred into the water, making the water particles oscillate with a specific period that depends on the wind speed.
By stimulating the neighbouring particles to oscillate as well, the wave propagates and transports the energy (not mass!) across the sea.
You can superimpose waves in all directions and with (almost) every period, so sea state information is spectral information.
Wind sea
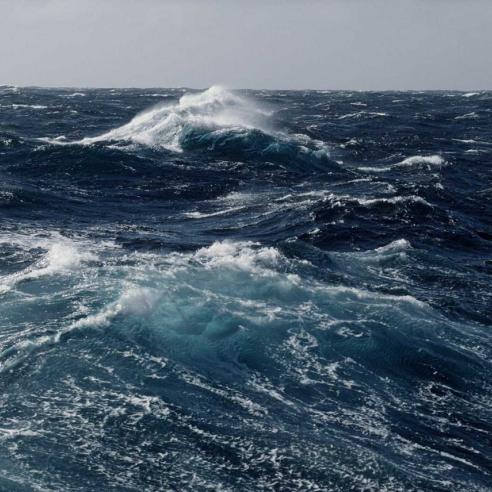
Due to turbulence in the wind field it's not only one wave period and one direction where the energy is transferred to, which makes the spectrum blurry and the ocean looks chaotic. All waves that can be explained in the spectrum with the current wind field are termed as “wind sea”.

The higher the wind speed, the higher the period and the wavelength of the wave, and also the higher the wave, at least if the wind has enough time and space to form the wave.
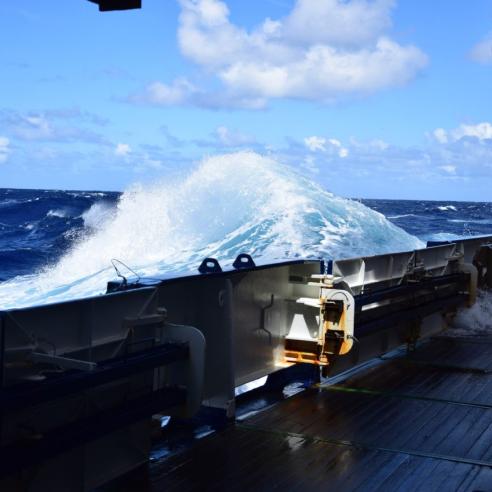
See Image 1 as an example for a wind sea with the wind blowing with 3 to 4 Beaufort for several hours. These waves can reach a significant height of 1.5m.
Significant wave height
This brings me to another definition, the significant wave height what is the value that is always the number which is predicted in the forecast and observed.
It sounds complicated: it is the average height of the highest third of all waves. So, if you have nine waves, the first one 1m high, second 2m and so forth until the last one with 9m, then the highest third are the waves 7m, 8m and 9m, so the significant wave height is 8m. This is the value a trained observer would estimate from watching the sea, because the high waves dominate the look of the sea.

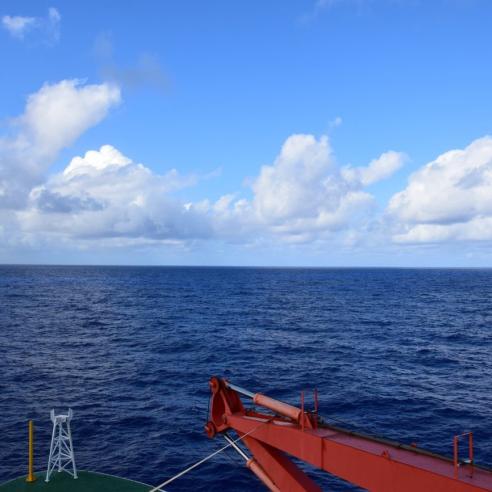
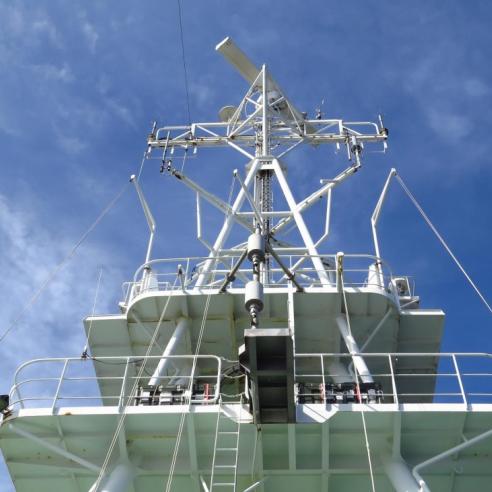
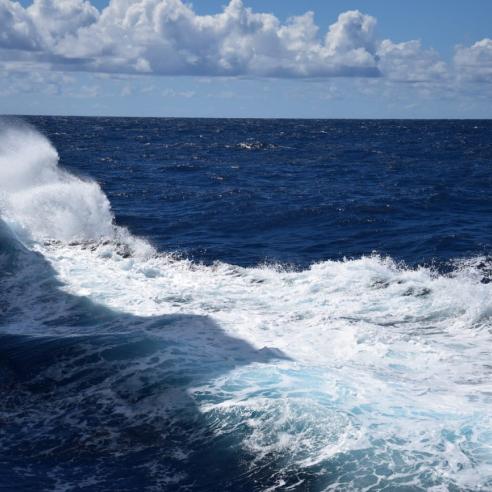
Keep in mind that it is a mean value which means that a certain amount of waves are higher than the significant height: statistically one of 100 waves reaches a factor of 1.5, one of 3000 waves will be twice as high as significant. Assume a wind sea with a period of about 6 seconds and a significant height of 3m which can be the result of 6 Beaufort (Image 2) after some time. Then every 10 minutes there will be a wave of 4.5m, and every five hours one wave will be 6 m high (Image 3).

With long lasting winds, the waves of the corresponding period will not grow over every limit. Due to non-linear interactions inside the waves, energy is transferred from the period with maximum energy driven by the wind both to shorter periods where it will finally vanish from the spectrum due to friction, and to longer periods (and longer wavelengths).
Swell
With increasing wavelength, the propagation speed of the wave also increases, and finally the wave will run out of the wind field. Without any more forcing it will run across the ocean with constant speed and a slow loss of energy until it approaches a coast. This part of the spectrum that cannot be explained by the current wind field is called swell.
Because of the different propagation velocities, the swell looks much more regular than the wind sea, especially when no wind sea is superimposed. On the other hand it is sometimes hard to recognize even a high swell because the waves are so long, and the estimation of the height might be almost impossible. But to identify swell directions and heights might help to locate distance wind fields. That's what we experienced during recent days.
En route from Gran Canaria
After leaving Las Palmas (Gran Canaria) on Tuesday afternoon - where another group of about 40 students, teachers and scientists came on board - we are sailing again in an area of very low pressure gradients. The analysis (Image 4) shows the low pressure system near the Azores that will remain stable also over the next days, and another weak low near Gibraltar. In between, pressure gradients almost deceased, so the wind achieved not more than 2 Beaufort after leaving the harbour.

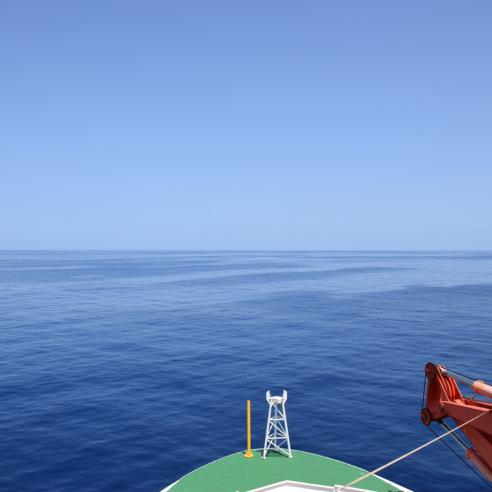
Nevertheless the vessel made distinct pitch movements due to the long swell that came in from the north-west, from the direction of the low, with a significant height of about 2m. Image 5 gives an impression what this swell looked like when there was only weak wind above.

A nice tool to help in estimating the significant wave height is another microwave instrument, available on several satellites today: the altimeter. It is transmitting a microwave pulse down to the ocean surface just as the scatterometer I mentioned last time, but this measurement is the strength of reflexion depending on time.

(https://manati.star.nesdis.noaa.gov/datasets/SGWHData.php)
The slope of the signal then contains the information about the wave height. When available in near real time, the data of the last hours can be and are used for assimilation in numerical wave models. For the forecaster the data give a nice overview over the situation in the surrounding area (see Image 6), even if the data are a few hours old.