Using satellites for climate research
Getting satellite data to do the talking.


For the past 20 years, the DWD (Deutscher Wetterdienst – the German National Meteorological Service) has been working with a group of experts, using satellite data to monitor the climate and to record changes.
18 May 2022
28 May 2019
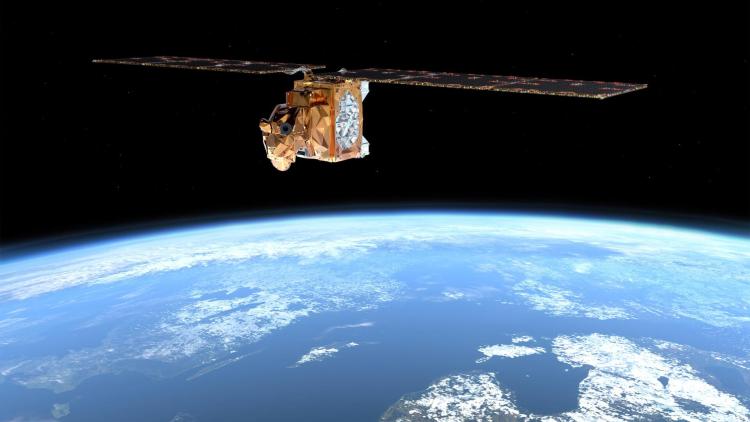
The Satellite Application Facility on Climate Monitoring (CM SAF) provides datasets to some 3,500 users worldwide. This data can be used to help improve the design of photovoltaic systems, for example.
Offenbach, 27 May 2019 – CLARA, CLAAS and SARAH. You may be mistaken for initially believing that these refer to high and low fronts in the world of meteorology. However, these are the names given to large virtual index cards based on an almost infinite volume of satellite data collected over a specific period of time as data records for climate research. Datasets like CLARA, CLAAS and SARAH are compiled by the Satellite Application Facility on Climate Monitoring, in short CM SAF. This centre, which specialises in the analysis of satellite climate observation data, is located at the DWD head offices in Offenbach. It is one of eight similar centres across Europe that come under the umbrella of EUMETSAT (the European Organisation for the Exploitation of Meteorological Satellites) and are hosted by its Member States. These centres are responsible for interpreting and presenting satellite data so that it can be used by scientists, researchers and economists.

The aim of the CM SAF is to use satellite data to record information about the Earth’s climate over as long a period of time as possible, to investigate this information and record any changes. To this end, CM SAF experts from Belgium, Germany, Finland, France, Great Britain, the Netherlands, Sweden and Switzerland analyse raw data from satellites, with particular focus on the energy and water cycles in the atmosphere. Water is an essential part of the energy cycle.
Around 3,500 customers worldwide use the CM SAF’s free datasets. Besides national weather services and international research institutes, users include commercial businesses, as well as insurance companies and assessors.

A solar atlas for solar energy
A solar atlas was published in 2015 and 2016 for each of the three Baltic States, as well as for Poland. These atlases are based on the CM SAF data record, SARAH. The name SARAH stands for Solar Surface Radiation Data Set – Heliosat. In other words, solar radiation. After Spain published the first ever solar atlas based on CM SAF data in 2012, the Baltic States and Poland decided to follow suit. SARAH contains data from January 1983 to December 2017, relating primarily to Europe and Africa. It includes data gathered by EUMETSAT’s geostationary Meteosat satellites. SARAH contains information about sunshine duration (SDU), surface incoming shortwave radiation (SIS) and surface incoming direct radiation (SID).
The radiation data in SARAH can be analysed according to different temporal and geographical filters. Data can therefore be filtered by annual, monthly or daily mean values and any anomalies in radiation values can be detected. These satellite observations also enable radiation data collected at the meteorological ground stations to be verified. The radiation atlases for the Baltic States and Poland contain a total of over 5,000 maps showing how much radiation the Earth received at a specific time and place, and what this translates as in terms of potential solar energy. This is of significant interest to the designers of buildings and larger facilities, if these are to generate solar energy. The fact that data has been collected over a long course of time enables users of the datasets to identify changes more easily.
In Switzerland, for example, the results of the CM SAF evaluation have been used to link radiation data to specific buildings, to ascertain whether or not it is worth installing solar panels on the roof of the property or not.
Other countries have followed in the footsteps of Poland and the Baltic States. Today, Egypt, Kazakhstan and Greece also have solar atlases based on CM SAF data.

A combination of satellite and ground station data
A special collaborative partnership exists between the CM SAF and the Global Precipitation Climatology Centre (GPCC) of the World Meteorological Organization (WMO), which is also based at the DWD’s offices. The GPCC has been gathering, analysing and evaluating precipitation data from more than 115,000 land-based observation points around the world for over 30 years. These analyses are then provided in the form of ”gridded” datasets. For example, the United Nations’ Food and Agriculture Organization (FAO) uses GPCC data for predicting droughts and crop yields. UNESCO's International Hydrological Programme also uses the data to determine the global water budget, as well as global drinking water resources.
The CM SAF and the GPCC have merged their precipitation data with the aim of global climate monitoring. In other words, data from the CM SAF representing the precipitation recorded by satellite – primarily over the oceans – has been combined with GPCC data showing precipitation values on land. This has resulted in the two institutions providing a global dataset containing the two different sources of data. This global dataset is a considerable help when establishing medium-term climate forecasts. The CM SAF and the GPCC have also established a global map of precipitation extremes, showing the frequency distribution of heavy rainfall. If heavy rainfall occurs particularly frequently in a certain region, precautionary measures can be taken at a local level. For example, this type of data can be consulted when planning sewage systems or retention basins. There are plans to further expand the partnership between the CM SAF and the GPCC.


SAF: A network of networks
The way in which the different SAF units are organised is simple: A national meteorological service from a EUMETSAT Member State is responsible for a particular topic. Other national weather services or institutions act in the capacity of scientific partners. Back in the 1990s, these networks of experts enabled EUMETSAT to encourage the participating Member States to significantly exploit and develop the potential opportunities that satellite data bring in the fields of meteorology and climatology. This resulted in the establishment of eight SAF units, which constitute a network of networks. Each SAF is responsible for a specific specialist area for which it evaluates the satellite data and publishes the corresponding datasets:
- Climate monitoring (CM SAF): Deutscher Wetterdienst (DWD, German Weather Service, Germany)
- Hydrology and water management (H SAF): Servizio Meteorologico dell’Aeronautica Militare (MeteoAM, Italy)
- Atmospheric composition monitoring (AC SAF): Finnish Meteorological Institute (FMI, Finland), which partners with the DWD
- Land surface analysis (LSA SAF): Instituto Português do Mar e da Atmosfera (IPMA, Portugal)
- Support to nowcasting and very short-range forecasting (NWC SAF): Agencia Es-tatal de Meteorología (AEMET, Spain)
- Oceans and sea ice: Météo France (France)
- Numerical weather prediction: Met Office (Great Britain), which partners with the DWD
- Radio occultation meteorology: Danish Meteorological Institute (DMI, Denmark)
From scepticism to conviction
The CM SAF launched a five-year project phase at the DWD in 1999, followed by an initial operational phase that lasted until 2007. Since then, the CM SAF has followed a five-year cycle during which they develop their findings and promote new research related to their mission of using satellite data to support climate observation. These five years are referred to as the “Continuous Development and Operations Phase”, or the CDOP. This approach not only underlines the commitment to continuous development and the final operational phase, but also emphasises the application of the latest technological and scientific knowledge.
Today, the CM SAF is in the third CDOP phase, which is due to last until February 2022. Preparations are already underway for CDOP4 (2022–2027). The following institutions have established active partnerships with the CM SAF: the Centre National de la Recherche Scientifique (CNRS, France), the Finnish Meteorological Institute (FMI), the Royal Netherlands Meteorological Institute (KNMI), the United Kingdom Met Office (UKMO), the Royal Meteorological Institute of Belgium (RMI), the Federal Office of Meteorology and Climatology MeteoSwiss (Switzerland), and the Swedish Meteorological Hydrological Institute (SMHI).
"When we first launched the CM SAF in 1999, I was sceptical about what we would be able to interpret from the satellite data and how we could use it to make predictions about the climate and climate change."
Reports Martin Werscheck, head of the CM SAF at the DWD. Twenty years later, there’s not even a hint of scepticism. On the contrary, users are euphoric about the potential that the weather satellites are opening up.
"Over the course of the past two decades, the SAF units have become successful models. We have demonstrated the tremendous benefits of satellite data. Firstly, we now have spatial coverage of the entire surface of the Earth, which we would not have been able to achieve with any other Earth observation system. And secondly, high temporal resolution means that we sometimes receive new data every five minutes. Only satellites are capable of providing this blanket coverage. And there’s still a lot more potential to be exploited."
Satellites have brought us into a new era
On 3 March 1966, a new era began at the DWD in Offenbach. It was on this day that the DWD headquarters received the first set of data from weather satellites. Three times per day, the ESSA 2 satellite transmitted information about cloud structure, areas of high and low pressure and front movements. Today, satellite data can be sent at five-minute intervals, which will be reduced to two and a half minutes in the future. The volume of data has also multiplied. Besides the structure of the atmosphere, the meteorological parameters that can be determined from satellite data today include temperature and humidity profiles, wind, ice distribution, the height and temperature of the sea surface, snow cover and global radiation. Meanwhile, many other satellites have followed ESSA 2 into space. The number of satellites orbiting the globe is continually increasing and so, too, is the volume of data sent back down to Earth and used by the CM SAF at the DWD.
"The raw data that provides the foundations for our work is received from the EUMETSAT satellites, as well as from American and Chinese weather satellites."
Explains Martin Werscheck.
"When we receive the raw data – which is nothing more than endless columns of binary codes – it has simply been stamped with the time and place. In other words, we know when the data was collected and to which particular place on Earth it corresponds. This is where we set to work, developing an algorithm that enables us to quantify the data in geophysical terms. Basically, the raw data is like a foreign language from outer space, which we need to “translate” using an algorithmic tool so that users around the world can understand and use the data."
The CM SAF data that has been collected over a period of more than 30 years includes, for example, radiation, cloud cover, water vapour, temperature, the top and base of clouds, the optical thickness of clouds and precipitation.
Up to four years
It can take up to four years from the moment work begins on the raw data to the publication of a comprehensively calculated dataset. There are a multitude of different steps involved. First of all, users need to determine which information they need from the satellite data, as well as the quality of this information. These requirements are assessed by international experts based on the latest scientific knowledge. Once this has been established, the CM SAF sets to work, firstly defining the methods by which the datasets will be derived from the satellite information. Next, these methods are assessed to verify that they are adequate and that the expected results will correspond to what the users need. Only then can the creation of the datasets begin. It is an extremely computer-intensive process that requires a high-performance computer. In most cases, the CM SAF relies on a computer based at the European Centre for Medium-Range Weather Forecasts (ECMWF) in Reading, England. Before a dataset can be published, detailed documentation needs to be drawn up. This enables users to understand how the dataset was created and what information it contains in terms of their needs. The entire package is thoroughly checked by a panel of experts.
Back to CLARA, CLAAS and SARAH
CLARA is a global dataset containing data from January 1982 to December 2015. It contains data collected over one of the longest time series, based on satellite data relating to clouds, albedo (sunlight reflected by the Earth’s surface) and radiation. CLAAS and SARAH are regional datasets that primarily illustrate conditions in Europe and Africa. While CLAAS is concerned with cloud characteristics, SARAH – as described above – focuses on solar radiation.
Other datasets also exist, such as HOAPS (Hamburg Ocean Atmospheric Parameters and Fluxes from Satellite Data). HOAPS provides different climate information, including precipitation, evaporation and thermal currents over ice-free ocean zones. Data covers the period between July 1987 and December 2014 and is of key importance in the field of marine research.
Interaction with users
One of the secrets that lies behind the successful and diverse use of CM SAF data lies in the close interaction with users. As mentioned above, user requirements are fed into the next development phase for the creation of future data sets or development of existing records. Users are invited to take part in continuous training and development, as well as in regular opportunities to share their experience, in order to get the best possible use out of existing data.
The CM SAF has adopted a modular approach to training to ensure that courses held around the world are as effective and goal-oriented as possible. This ”toolbox” provides users with guidance on the practical evaluation of datasets. More than 50 different keywords, referred to as ”operators”, enable users to filter, analyse and process the datasets according to specific parameters, depending on the individual needs of the user. Finally, the toolbox presents the evaluations and analyses offering the user a choice of how the data should be displayed.
The future
The fifth user workshop, which will be held in Mainz from 3 - 5 June 2019 to coincide with the 20th anniversary of the CM SAF, is right on the cusp of the future. Some 130 guests from more than 30 countries have already registered for the event. The workshop will revolve around the concept of different working groups, which will not only be discussing the actual interpretation of the satellite data, but also the potential uses to which the data can be put.
Martin Werscheck is convinced that satellites will have more to tell us in the future. This is not only due to the growing number of weather satellites, but also technical progress, which means an increased number of improved sensors and, in turn, a significantly greater number of parameters that can be derived from the satellite data. Time series will also become longer as a result, the temporal and spatial resolution of satellite data will increase and our skills in processing and understanding satellite data will continue to grow.
All this means that the CM SAF data ”translators” will need to expand their current translation tools in order to continue understanding and exploiting the language of the satellites.
The author Gertrud Nöth, Press Relations, DWD Telephone: +49 (0)69 8062 45 05, email: gertrud.noeth@dwd.de
Relevant research material: - Information about the CM SAF at the DWD: www.cmsaf.eu
- Registration for data access: www.cmsaf.eu/wui
- CM SAF on Twitter: @Climate_SAF
- Example applications: https://www.cmsaf.eu/EN/Outreach/Applications/Applications_node.html
- Information about EUMETSAT: www.eumetsat.int
List of abbreviations: - CDOP: Continuous Development and Operations Phase
- CLAAS: Cloud Property Dataset using SEVIRI
- CLARA: Cloud, Albedo and Radiation Dataset
- HOAPS: Hamburg Ocean Atmospheric Parameters and Fluxes from Satellite Data
- SARAH: Surface Solar Radiation Dataset – Heliosat
- SDU: Sunshine Duration
- SID: Sunshine Incoming Direct Radiation
- SIS: Sunshine Incoming Shortwave Radiation
- GPCC: Global Precipitation Climatology Centre