23 June 2025
15 June 2020
The data is intended to be used to test the operational processors which will be developed (via parallel activities) to analyse flight data. Data from the study was delivered in the planned (level 1) format for top-of-atmosphere (TOA) radiance data from the CO2M spectrometers.
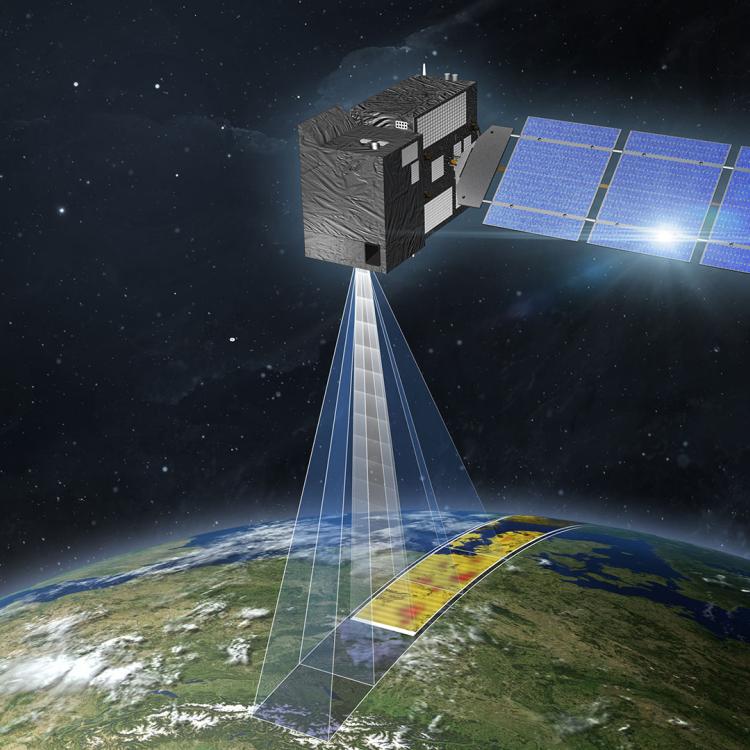
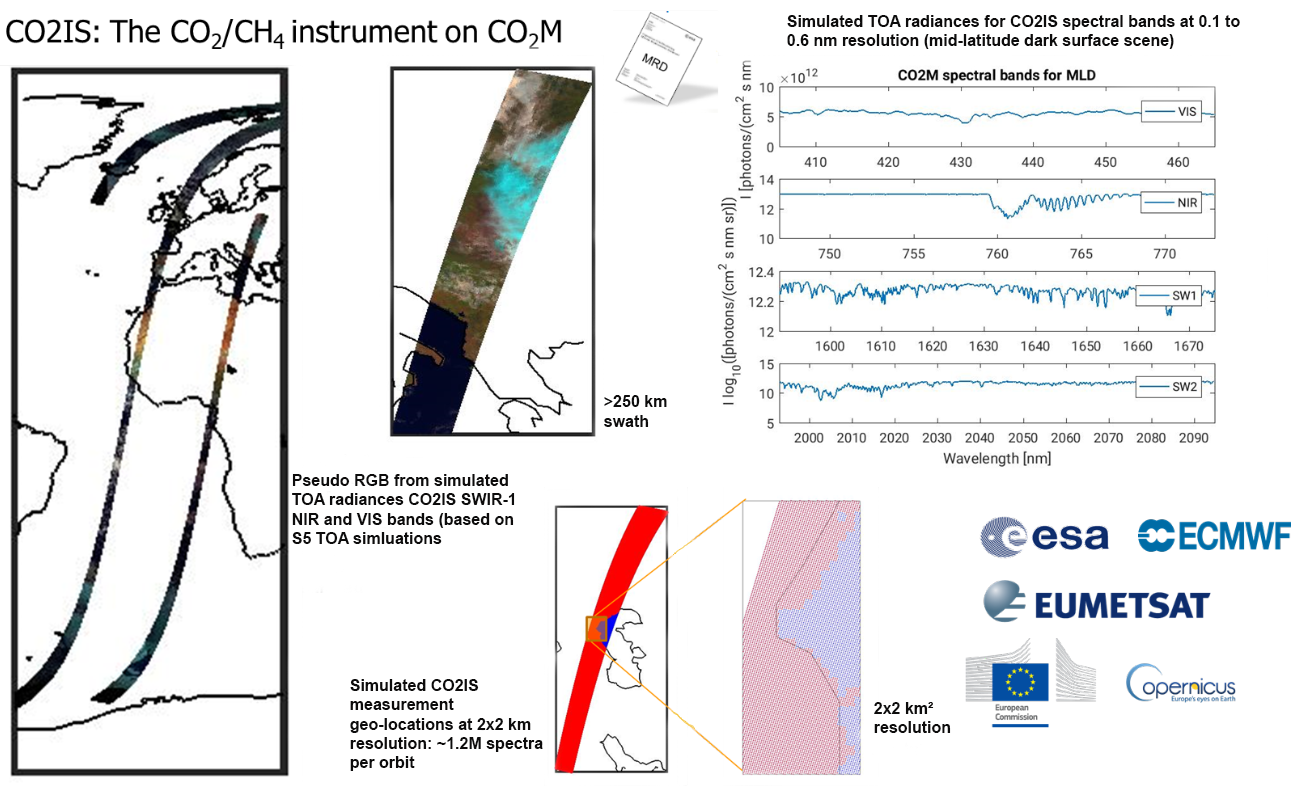
The main instrument on the CO2 monitoring platform CO2M is the imaging grating spectrometer (Figure 1), measuring in the visible region between 405 and 490nm, in the near-infrared between 747–773nm and in two bands in the short-wave infrared between 1590–1675 and 1990–2095nm, with a spectral resolution between 0.12 and 0.6nm. This study simulated Top-of-Atmosphere radiances from these instruments for multiple day-side orbits.
Objectives
- Implement a documented and configurable system for realistically simulating radiance measurements by the visible/near-ir/short-wave-ir spectrometers (NO2IS and CO2IS) on the CO2M.
- Use the system to generate (at least) three orbits of realistic level-1 data. Orbit geometry, sensor spatial sampling and level-1 format are being provided by EUMETSAT. Correctly formatted level-1 files will be provided, containing all necessary information to enable the level-2 processors to be realistically tested.
Overview
Accurate simulation of the CO2M spectrometer radiances is highly computationally intensive — it involves modelling polarised multiple scattering in the atmosphere and at the surface, including detailed representation of the many molecular absorption lines. This study benefitted from the development of a principal component forward model (PCFM, [RD04]) during similar EUMETSAT studies for Sentinels 4 and 5 [RD02]. This approach enables the simulation of full instrument resolution spectra from rigorous radiative transfer calculations performed for a limited subset of (few 100-1000) monochromatic points per instrument spectral band. The basis of the approach is to use a 'training set', for which full simulations are performed (comprising many thousands of scenes) to develop a linear regression between radiances at a chosen subset of monochromatic points and full-band, instrument resolution spectra. Within this study we used the line-by-line model RFM, coupled to the vector scattering model VLIDORT [RD03] to perform the monochromatic calculations for each simulated CO2M scene. The relevant atmospheric parameters, including all relevant gases, aerosol and cloud, are taken from high resolution model fields, while surface properties are generally based on high resolution observed data (e.g. from MODIS [RD06]), coupled to databases describing their optical properties.
Work within this study focused on developing suitable geophysical scenarios for CO2M, then adapting and applying the S4/5 tools to generate the test data. The work was divided into four tasks:
- Setup of the radiative transfer model and selection of input data. In this task, options for defining the necessary geophysical and spectroscopic input data were considered and iterated with EUMETSAT and external L2 developers. Following the statement of work [RD01], the basis for the atmospheric state was model output from the Copernicus Atmosphere Monitoring Service (CAMS) CO2 forecasting system, produced in the CO2 Human emissions (CHE) project [RD05]. We used global output (produced at ~10km spatial resolution by the ECMWF high resolution forecast model) together with high resolution output over Europe (~5km resolution) and Berlin (~1km resolution) from the LOTOS-EUROS model. In the case of cloud, a statistical model was developed to enable realistic fine-scale (1km) spatial structure to be simulated based on the 10km resolution ice and liquid water content profiles from the CHE global model.
- Collection of input data. 'Orbit' files were provided by EUMETSAT, in the level 1 (L1) format, with information on the geolocation and view/solar geometry to be assumed for the study simulations (i.e. without spectra). In total six complete CO2M orbits were defined, comprising one orbit each from three CO2M platforms flying in close formation on two days (3 July and 23 September 2025). On each day, two orbits ('central' and 'eastern') are assumed in nadir viewing mode, while in the western orbit the platform pointing is controlled to optimise the occurrence of sunglint observing conditions. These orbit files also define the spectral sampling of the CO2M bands. For the purpose of this study, CO2M is assumed to have a simple Gaussian spectral response with spectral resolution fixed for each band, following initial instrument design information. Within this task, 'scenario' files were produced which contain all the spatially variable geophysical input data resampled to the centres of all CO2M observations, in each of the orbit files.
- Production of the CO2IS datasets. After training and optimising the PCFM, simulations for the selected monochromatic points were carried out for all scenes in the six orbits. These calculations were carried out on the UK Jasmin high performance computing facility. Approximately 100,000 CPU days of effort were required to complete all simulations.
- Project outreach. A project webpage has been created and results have been presented at the EUMETSAT conference in Brussels [RD08].
The simulations produced in the study have been supplied in the form of L1 files in the planned operational format, together with all input and intermediate output files (as described in a separate delivery note [RD07]). Plots summarising the results have also been produced, including in the form of kmz files which can be viewed in Google Earth. For all orbit granules, L1 files have also been produced in which no cloud is included in the simulation, to enable the full orbit to be processed by the full L2 chain, without filtering scenes for cloud. In addition, L1 files have been provided with some detailed radiative transfer effects switched-off — polarisation, Ring effect and solar-induced fluorescence.
Results
Results from the study are illustrated in the figures below.
Figure 2 shows false colour images illustrating the detailed realistic structure in surface and cloud properties included in the simulations. Note the appearance of sunglint in the western orbit, particularly towards high latitude. The false colour images are formed as an RGB composite in which red, green and blue channels shows the reflectance at 1590nm, 747nm and 405nm, respectively. The images are displayed in columns. Within each column, results images from the west, central and east orbit are shown alongside each other. The left hand column shows the first scan lines from each orbit. Columns from left-right show images from successive scan lines along the orbit. Maps under each column show the three orbits, with the green area indicating the area covered by the images above.

Figure 3 illustrates the total column average mixing ratio of CO2, which exhibits fine scale spatial structure over Europe, particularly around Berlin, thanks to the use of nested high resolution CHE model simulations in the study.

Figure 4 summarises the spectra produced, in the orbit granule containing Berlin. In each case, the mean simulated reflectance spectrum in shown in black (considering all ground pixels in the granule). Green lines show the mean +/- one standard deviation. Blue lines show the minimum and maximum reflectance spectrum.

Work was also undertaken to transfer study assumptions and input data to a parallel EUMETSAT study (led by HYGEOS, CO2M MAP and CLIM Top-Of-Atmosphere simulations) which will simulate consistent test data for the CO2M imagers (CLIM and MAP). Scenario files have also been produced for complete global sampling of the two days (3 July and 23 September 2025) by the three platforms. These can be used by EUMETSAT or other L2 teams to generate further test data, e.g. by applying the radiative transfer model of a given L2 scheme to simulate the radiance spectra.
Reprocessing
Since kick off of the study in 2021 and the delivery of the first version of the data in 2022, the CO2I/NO2I spectrometer instrument design underwent a few significant evolutions, together with the design of the associated level-1 to 2 processing, which consequently required an update of the forward model and the test-data to be prepared for the version 2L developments of the operational Instrument Processing Facilities (IPFs) at EUMETSAT and in-line with their Critical design review (CDR) specifications. Tasks included:
- Update the treatment of the lowest model layer
- Update the use of BRDF parameters
- Implement a mixing of ocean/land and/or ice in the scene as provided by ancillary information
- Describe the potential usage of alternative ISRF data (post-processing) in a dedicated section to the updated technical report.
Details of these updates have been added to the Final Report.