Arctic sea ice minimum 2019 – how did it fare this year
An annual occurrence when the area/volume of Arctic ice has reached its smallest after the “summer melt season”.

Sea ice in the Arctic Ocean has been melting faster in recent years due to a rise in global temperatures, which has implications for the rest of the planet and is a driver of climate change.
17 May 2022
02 October 2019
Kenneth Holmlund, Chief Scientist at EUMETSAT explains.
"The dramatic reduction in Arctic sea ice has far bearing implications. Not only does it change the global weather and climate, it directly affects the local life and livelihood of the indigenous people, whilst also opening up the Arctic for increased commercial exploitation, especially fishing, marine transport, tourism and oil drilling.
It is therefore important not only to monitor the climate changes, but also to deploy adequate observation systems to ensure safe operations and sufficient support in case of emergencies."

What have we witnessed this year?
Dr Rasmus Tonboe, Sea Ice Researcher at the Danish Meteorological Institute (DMI) talked to us about the sea ice situation for 2019:
"Compared to the last 40 years, for which we have satellite observations of Arctic sea ice, the minimum sea ice extent did not set a new record this year. While being about 2 million km2 below the 1981-2000 average, it is still above the 2012 minimum record. The annual minimum is the second lowest minimum in the 40-year data recorded by satellites since 1979 tied with 2007 and 2016. However, during April and later during July until mid-August 2019, the sea ice extent was record low for the season.
September 18 marked the end of the melt season and the beginning of the ice growth season. Over the next six months, the sea ice will expand by approximately 10 million km2. The Sun over the North Pole set on September 20 for the autumn equinox and will not rise before March 2020, so temperatures are well below freezing now.
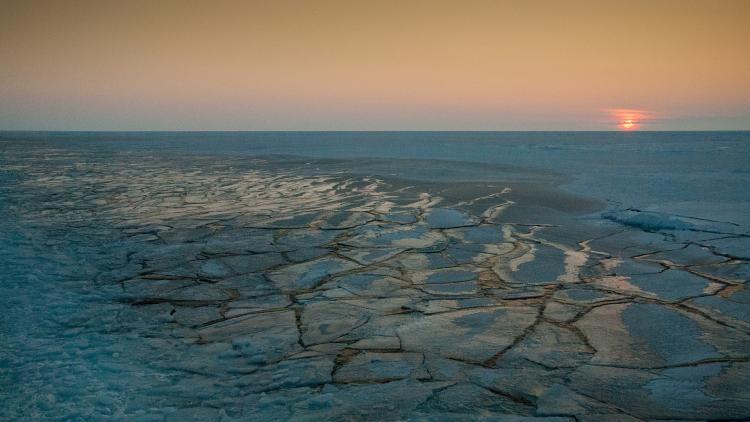
The melt in the North Pole area started about a week earlier than normal in June and in some regions along the ice edge, the sea ice broke up about a month earlier than what is considered normal. Warm air outbreaks caused sudden melting, for example in North-West Greenland."

More on melting sea ice
The top of the atmosphere above the North Pole receives the most solar radiation during midsummer than any other place on Earth. When the snow on the sea ice starts melting, it changes its ability to reflect sunlight. Melting sea ice absorbs more sunlight than cold and freezing sea ice. Therefore, the combination of high temperatures and clear skies in June, when the central Arctic starts melting, can change the sea-ice energy balance so much that an early melt in June is correlated with a low sea ice extent in September.
The sea ice cover, or rather the absence of sea ice, has a direct influence on the heating of surface waters during summer. Along the Siberian coast, Baffin Bay, in the Bering Strait and in the Greenland Sea there are currently large areas where the surface water temperature is 2⁰C, 3⁰C, and even 4⁰C above normal levels. The high water temperatures will delay the re-freeze this autumn.
Our eyes in the sky
Amongst many other things, satellites monitor sea ice area and volume. The data derived from their observations (for example, sea ice minimum data) helps scientists gauge the current state of the Arctic. Any abnormalities can be compared to previous years in order to study changes, predict future patterns and determine what is ‘normal’/what might be cause for alarm.
To get to a homogeneous data record of the sea ice cover spanning over 40 years, data from the instruments on board American and Japanese satellites are used, including:
- The Scanning Multichannel Microwave Radiometer (SMMR)
- The Special Sensor Microwave/Imager (SSM/I)
- The Special Sensor Microwave Imager / Sounder (SSMIS)
- The Advanced Microwave Scanning Radiometer-EOS (AMSR-E)
- The Advanced Microwave Scanning Radiometer 2 (AMSR2)

One institution making use of this data by processing and sharing it with users worldwide is the Satellite Application Facility on Ocean and Sea Ice (OSI SAF). Working together with the OSI SAF, we are able to produce products such as this polar ice animation that gives a clear overview of ice concentration and makes it possible to visualise the data collected by satellites.
The OSI SAF
The OSI SAF develops, processes and distributes, in near-real time, products related to key parameters of the ocean-atmosphere interface. The OSI SAF also prepares climate data records.
Products are accessible on local FTP servers with flexible extraction interface, EUMETCast, and the EUMETSAT Data Center (EDC).
The OSI SAF team focuses on sea ice (concentration, edge, type, emissivity and drift), scatterometer winds (and soon microwave winds), Sea Surface Temperature (SST) and sea Ice Surface Temperature (IST), radiative fluxes: Solar Surface Irradiance (SSI) and Downward Longwave Irradiance (DLI).
The OSI SAF currently use data from meteorological satellites both in geostationary and polar orbit.

They offer many products, including data records that are related to key parameters of the ocean-atmosphere interface.
Visitors to the OSI SAF website are also able to get a daily view of Arctic sea ice conditions, here.
Thomas Lavergne, Scientist at the Norwegian Meteorological Institute works with OSI SAF. Here, he explains how exactly they monitor sea ice concentration and extent.
In addition, they have been flying on board various satellites for the last 40 years, so that we can measure how climate change affects sea ice and the polar regions over a long period. Of course, things are not that simple and we are putting a lot of effort into improving our retrieval algorithms, and how we quantify and report the remaining uncertainties.
We recently updated our sea-ice concentration climate data record with new algorithms, partly contributed to by the Climate Change Initiative programme of the European Space Agency (ESA). The data can be accessed by everyone via the OSI SAF website.
The work we do now using the current operational satellites gets us ready for future missions."
Over the next decade, EUMETSAT will be able to extract more products from its future missions, including more frequent observational coverage of the Arctic – a region that is becoming increasingly important for weather forecasts in Europe.
The EUMETSAT Polar System – Second Generation (EPS-SG) mission will bring observations to a new standard, through the suite of innovative European instruments flown on the Metop-SG spacecraft including the Microwave Imager (MWI), which will provide all-weather surface imagery, including sea ice coverage and type, snow coverage and water equivalent. Read more about the mission here.
Data from current operational EUMETSAT satellites, such as the Metop satellite series can also detect Arctic ice cover via the on-board Advanced SCATterometer (ASCAT) instrument.
As climate change and changes in the Arctic are already a reality, the risk needs to be managed through suitable adaptation policies.
Anders Oskal, co-author of the Intergovernmental Panel on Climate Change (IPCC) “Polar Regions” chapter and Director of the International Centre for Reindeer Husbandry stated:
The IPCC is the United Nations body for assessing the science related to climate change. In their latest report, released 25 September 2019, it was stated that:
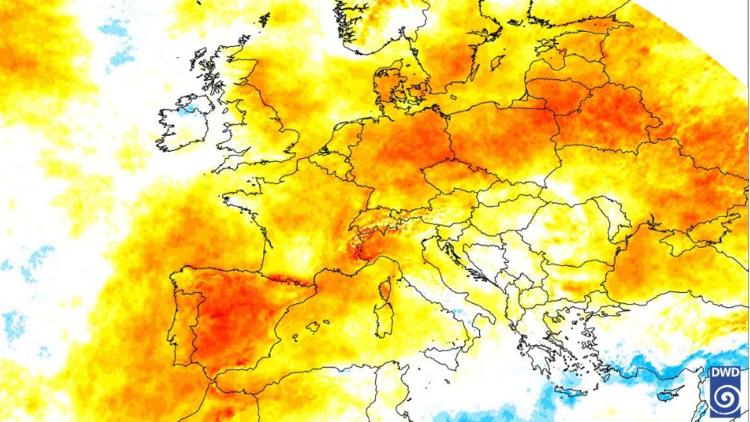
“Arctic surface air temperature has likely increased by more than double the global average over the last two decades, with feedback from loss of sea ice and snow cover contributing to the amplified warming”.
You can read the full chapter on polar regions within the 2019 IPCC Special Report on the Ocean and Cryosphere in a Changing Climate here.
Observations from the ground
Studies of the Arctic are crucial in order to better inform scientists, policy makers and society at large of the state of the polar regions and how what is happening there is affecting the rest of the world.
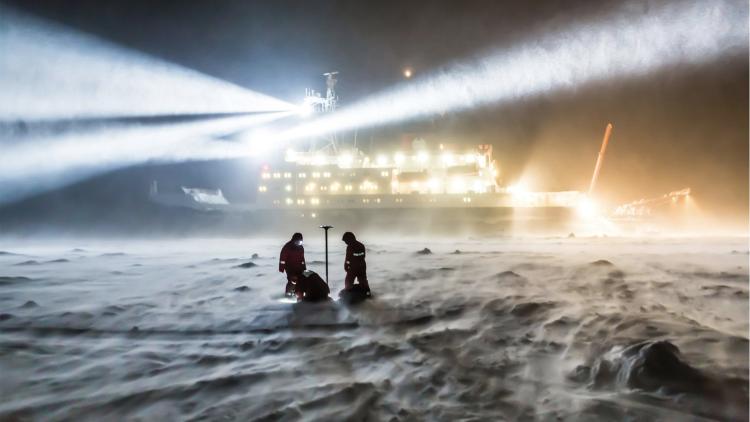
A study currently taking place in the Central Arctic is the “MOSAiC” Expedition (Multidisciplinary drifting Observatory for the Study of Arctic Climate) involving the powerful icebreaker: RV Polarstern (you might remember our articles featuring the Polarstern last year as the ship made its way from Germany to Cape Town).
This tough vessel will be spending this winter trapped (deliberately) in Arctic sea ice in order to study how climate change is impacting the Arctic.
Stay tuned here as we’ll soon be featuring blogs written by meteorology students from the German Meteorological Service, the Deutsche Wetterdienst (DWD) who are tracking the Polarstern’s expedition progress until the end of the year – it should make for some interesting reading!
This article includes contributions from:
- Kenneth Holmlund, Chief Scientist at EUMETSAT
- Dr Rasmus Tonboe, Sea Ice Researcher at the Danish Meteorological Institute
- Thomas Lavergne, Scientist at the Norwegian Meteorological Institute