
Mapping carbon monoxide to aid air quality forecasts
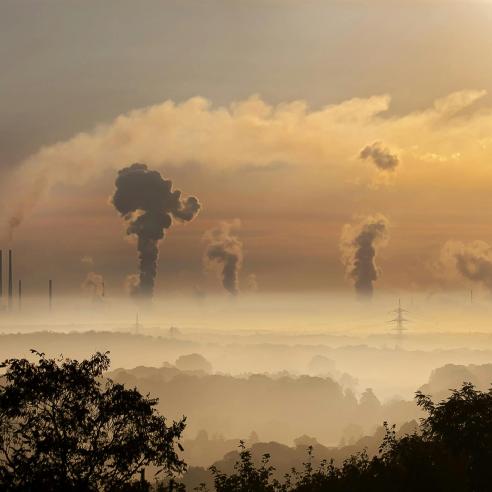
Carbon monoxide is an odourless, colourless gas normally present in low concentrations in the air we breathe.


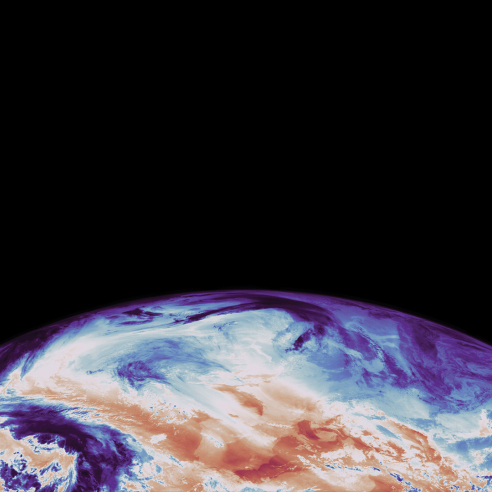
Monitoring carbon monoxide from space.
09 February 2021
03 July 2018
LATMOS Senior Scientist Dr Cathy Clerbaux said understanding carbon monoxide was crucial for understanding pollution and air quality.
Although carbon monoxide doesn’t last long in the atmosphere, satellite instruments can be used to detect it and track its path.
“Anything that burns produces carbon monoxide and carbon dioxide,” Cathy said. “It could be from fuel used by road transport or the air traffic industry, or from fires, including natural fires.
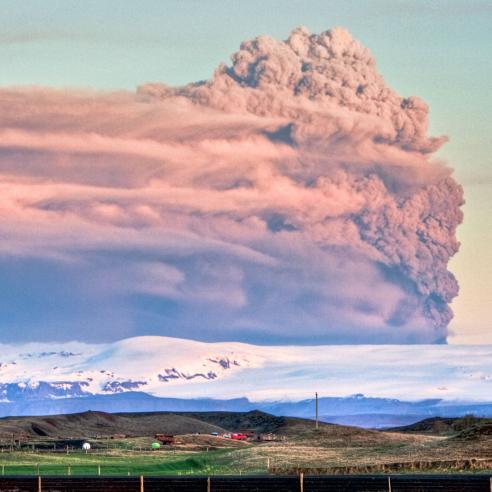
“The good thing about carbon monoxide is that it doesn’t stay very long in the atmosphere – only a few weeks. “When there is a fire, for example, we can track the carbon monoxide it produces and map it as it’s transported by the winds around the globe.” (See the images below)


This series of images shows how carbon monoxide produced by fires in Portugal in June last year was transport by winds across Europe. In the first image, high levels of carbon monoxide (the red dots) are seen near the area of the fire. The next day (the middle image) the fire plumes have been transported north by the wind. The image on the right, from the third day, shows how the carbon monoxide has spread over Europe. The white areas are due to clouds.
The IASI carbon monoxide product
The EUMETSAT Atmospheric Composition Monitoring Satellite Application Facility (AC SAF), is a consortium of agencies including LATMOS and is based at the Finnish Meteorological Institute. The AC SAF processes data on ozone, other trace gases, aerosols and ultraviolet data, obtained from satellite instrumentation.
The AC SAF has developed a product which detects and maps carbon monoxide using data from the Infrared Atmospheric Sounding Interferometer (IASI) on board EUMETSAT’s polar-orbiting Metop satellites. Metop-A and –B orbit the Earth over the poles and their path covers every part of the globe twice every day (four times in total).
“What we receive from IASI is a signal, like a barcode,” Cathy said “Part of it is the carbon monoxide signal – we have to extract it. When we extract it, we know the amount of carbon monoxide.”
The EUMETSAT AC SAF develops, produces, archives, validates and disseminates ozone and atmospheric chemistry products, to support the services of the EUMETSAT Member States in weather forecasting, as well as monitoring of ozone depletion, air quality and surface UV radiation. In addition, these products contribute to the implementation of the EUMETSAT strategy on environmental monitoring of the atmosphere. This is achieved at the European level by contributing to Copernicus activities, and on the global scale by implementing the global observations of the key atmospheric parameters, as recommended by the WMO Integrated Global Atmospheric Chemistry Observations Theme (IGACO) within the IGOS framework.

This graphic illustrates how carbon monoxide signals are extracted from IASI measurements. The top bar is one IASI measurement. This is called a radiance spectrum. IASI delivers 1.2million of these per day. The bottom two panels are simulations of what would be seen if (top) the atmosphere only consisted of water vapour (H2O and HDO) and (bottom) with only carbon dioxide (CO2), ozone (O3), methane (CH4), carbon monoxide (CO – in red) and nitrous oxide (N2O). Each molecule in the air has a specific “signature” when it interacts with the thermal infrared radiation emitted by the Earth. The small square shows the one for carbon monoxide with some interactions with those of CO2, N2O and H2O. From each atmospheric spectrum, a concentration of carbon monoxide can be retrieved for the location of the IASI observation. To do this, a retrieval algorithm must be applied.
How are the data used?
The Copernicus Atmosphere Monitoring Service (CAMS) uses the IASI carbon monoxide product, together with data from the MODIS instrument carried on NASA satellites, to produce air quality forecasts.
“CAMS produces maps that are a mix of satellite and model data,” Cathy said. “With these two satellite datasets they can provide forecasts for carbon monoxide.”
Incorporating satellite data into the forecasts ensures they are more reliable than modelling alone.
“If you have a fire that is not foreseen or a sudden fire and you don’t have satellite data, then the model will be wrong,” Cathy said. “If you have fires, and a model with the satellite data, you will see an increase in carbon monoxide. It makes the forecast more accurate.”

This animation shows carbon monoxide concentrations in 2014 and 2015. Fires in Indonesian were particularly severe in 2015 due to the effects of the El Nino and drought.