RV Polarstern
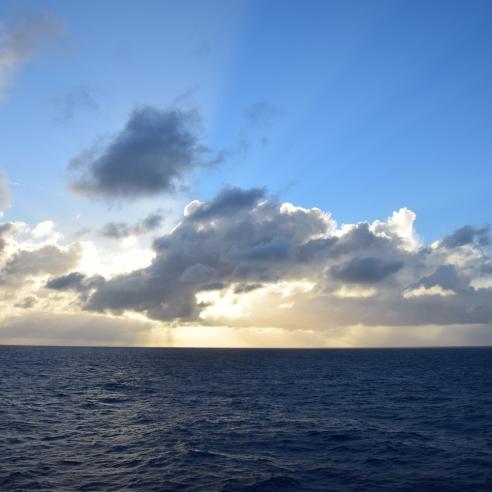
Squalls in the tropical South Atlantic, 07 April 2017.


On Monday, we passed the Inter Tropical Convergence Zone (ITCZ), an important part of the global circulation.
09 August 2021
07 April 2017
This area is marked by the highest temperature and highest absolute humidity on Earth, causing an area of permanent low pressure. It follows the Sun's zenith over the year, with an average location north of the Equator due to the distribution of the land masses.
In the traditional idea of a direct Hadley circulation, this low forces the trade winds from north and south, making them rise where they converge until they are stopped at the tropopause and therefore causing high rising clouds, then flowing away from the Equator in high altitudes. I will come back to the general circulation next week.
In fact, the deep convection is not a consequence of, but a necessary basis for the Hadley circulation, to transport energy and moisture. Therefore, the atmosphere must be unstable enough to allow deep convection to establish. Experience shows that these areas of convection have the tendency to build clusters, mainly depending on the amount of water vapor in the boundary layer.

Due to the satellite images of the days before, we knew that the ITCZ could be localized north of 05°S, even if the satellite image taken on Monday morning (Image 1) showed the main activity north of the Equator and only few clouds in the neighbourhood (position is marked with the white cross).

That corresponded well for the moment with the radiosonde data, which was launched at about the same time (Image 2), showing a slightly stable layer between 850 hPa and 750 hPa. The existing humidity could explain the relatively flat cumulus clouds that were observed at the same time, but to overcome the stable layer either the mixing layer needed to be heated, or become more humid, or both. At least the cirrocumulus clouds observed an hour earlier indicated that there was convective potential in high altitudes (Image 3).

So, would we experience a tropical storm? To cite Tobias, our forecaster, from his morning briefing with the Captain: “They will develop, and they will either hit us or miss us.” A classical thing for nowcasting, making short term forecasts on basis of the current observation.

In the afternoon, more and more clouds in the surrounding grew up, and at about 3 pm local time we had an overshooting system in front of us (Image 4), slightly starboard. Air temperature had indeed increased by about 1°C, compared to the time of the radiosonde launch, and dew point had also increased as an indicator of humidity.

About an hour later, the system was right in front of the vessel (Image 5). The anvil (partly to see on the right side of the image) showed that its movement direction had a component towards us. Another 15 minutes later, we could identify the squall line in front of the system (Image 6).

Just a quick course about thunderstorms: the centre of the storm is built by a strong updraft. Inside this updraft, even raindrops that otherwise would have fallen down are dragged along again, giving them the chance to grow more. When finally falling out of the updraft (which normally is sloped more or less due to the surrounding wind field), the now large raindrops drag air down, causing a down rush of cold air. At the surface, the down rush turns horizontally, causing the area of strongest gusts mostly in front and at the sides of the storm. Sometimes this area of turbulence establishes additional clouds below the storm cloud which reminds of a roller. This is the squall line.

The observation we made could be taken from a lecture book. At the very moment the squall line reached the vessel, air temperature dropped by almost 3°C (see red line in Image 7). The falling air has lost some of the humidity to the raindrops, so dew point also decreases (orange line in Image 7). Of course water temperature is not affected (blue line). Also the wind changes (Image 8). In the minute before the squall line approached (marked with the vertical dashed line) mean wind velocity (red line) decreased from stable 10m/s (5 Beaufort) to 5m/s (3 Beaufort) before increasing to 15m/s (7 Beaufort) on average within a few minutes.

Gusts reached 8 Beaufort. Wind direction that was southeast all the time (blue line, image 8) turned counter clockwise about 90 degrees in the same minute in front of the squall line, coming then directly from the storm. Precipitation started a few minutes later, indicated by the decrease in visibility (green line in Image 9). With the rain reaching its maximum, wind speed decreased drastically (images 8 and 9) in the area of the downdraft. Behind, wind direction turned again to south-east, but wind speed remained lower than before, for some hours.

Also shown in Image 9 are the measured base heights of the clouds, the ceiling, with blue crosses. Note the low clouds when the squall line approached. While the ceiling was at about 2000ft all the time, the roller clouds were found at about 1000ft.

To identify the area of the strongest updraft, satellite images are quite useful. There is a really good lesson available via EUMETrain about strong convective systems. As well as other composite satellite data, I often use the infrared channel for a first look. The reason is quite simple: in many regions of the world we only have a very reduced set of radiometer channels available, and many of the composites are only available for regions with Meteosat data. But this will hopefully change with time. Back to the IR image (Image 10).
It is used with a colour table that indicates the top temperatures (perhaps known as “cold ring colour table”). Coldest temperatures in brown show the area of strongest updraft. As you can see the main part of the storm passed us in the northwest. It was really an exciting meteorological event. But to be honest, it could not be classified as a thunderstorm, because in this system we couldn't detect lightning or thunder. And without observation it was only an impressive rain shower. Hopefully the lightning imager planned for the next Meteosat generation will improve the situation for this.