Future focus: Towards better flood and drought monitoring
How innovative approaches to remote sensing data are improving understanding of floods, droughts and the challenges posed by climate change

Remote sensing experts are opening up access to global and near-real-time observations of the water cycle. Wolfgang Wagner explains how this is improving our understanding of floods, droughts and the challenges posed by climate change
01 November 2023
23 February 2023
When Dr Wolfgang Wagner first saw the extent of open waters when mapping Pakistan’s devastating 2022 floods using radar images from the Copernicus Sentinel-1 satellite, he thought that there must have been something wrong with the data.
But after his team triple-checked the data and algorithms used to detail the evolution of the floods as part of a new Copernicus service to improve flood monitoring, Wagner – who is based at the Vienna University of Technology (TU Wien), Austria – realised that the data were telling the dramatic story of an unprecedented catastrophe.
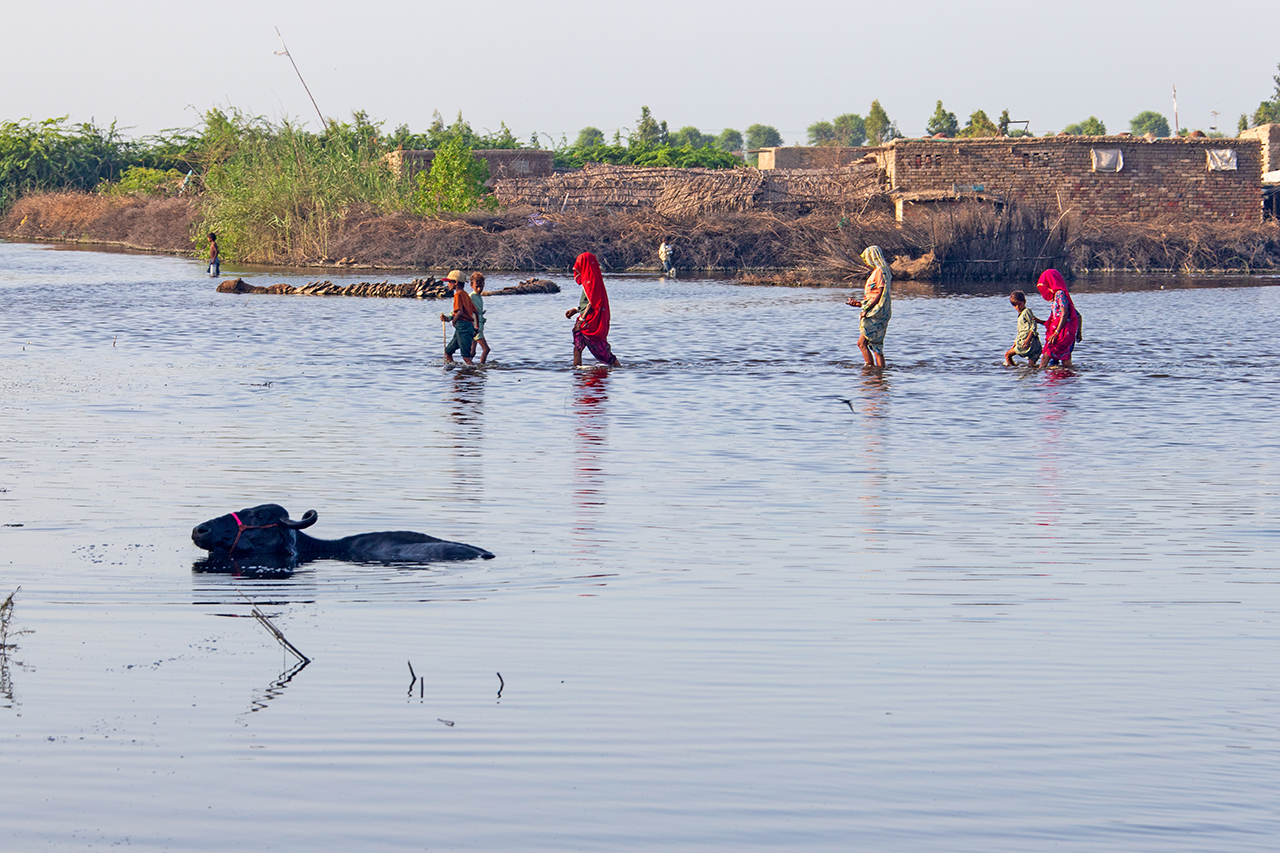
The post-flood analysis showed that at their peak, the massive floods submerged an area the size of Belgium – some 30,000km2. Large swaths of land continued to be submerged by flood waters even months after the event.
More than 1700 people were killed, 33 million affected, and more than two million homes were damaged or destroyed. It was one of the costliest natural disasters ever recorded. Communities in affected regions continue to face humanitarian emergencies.
“The 2022 Pakistan floods were off the scale compared to any flood event I had seen before,” says Wagner, Professor of Remote Sensing, whose team develop physical approaches that help decipher remote sensing data related to the water cycle. “I was completely dumbfounded.”

Credit: Courtesy of Wolfgang Wagner.
Pakistan Floods 2022 - Persistence into December
Flood maps based on TU Wien algorithim as part of the CEMS Global Flood Monitoring (GFM) ensemble product which automatically analyses images acquired by the Copernicus Sentinel-1 radar satellite.

Frequency of flood detection in period 18 August - 23 September 2022.

Flood area remaining in period 1 December - 15 December 2022.
Maps produced by Florian Roth, TU Wien. More information on the methods used can be found here.

The 2022 Pakistan floods are estimated to be amongst the most costly natural disasters ever.
Credit: UNDP Pakistan/Jamil Akhtar
Credit: UNDP/ Jamil Akhtar
Getting the bigger picture
As the major component of the water cycle, rainfall is the most critical and direct cause of flood disasters. However, it is not the end of the story. Wagner says that efforts to better monitor and predict floods can benefit from observations of other key variables relating to the water cycle, such as the water within snow, vegetation and soil.
“Soil moisture accounts for just a minor fraction of the world’s water resources, yet it has substantial influence on air temperature, humidity, rainfall, and other highly dynamic exchanges between the land and lower atmosphere,” says Wagner, whose team contributes to EUMETSAT’s Satellite Application Facility on Support to Operational Hydrology and Water Management (H SAF).
“Knowing the soil’s wetness or dryness can make important contributions to understanding the likelihood of floods or drought in a particular area. With the help of the Advanced Scatterometer (ASCAT) onboard EUMETSAT’s Metop polar-orbiting satellites we can produce soil moisture maps within around two hours after sensing.
“For example, in our analysis of the Pakistan floods, we saw in our ASCAT soil moisture data that soils were saturated long before the flooding. If we can better understand the correlations and get this information to authorities quicker, then it could help community response.”
To retrieve soil moisture data from ASCAT, Wagner’s team develops algorithms that filter soil moisture data from other features that impact the ‘backscatter’ from the satellite’s microwave signal, such as the roughness of the land surface, vegetation such as crops and forests, and concrete in urban areas.
“ASCAT transmits pulses of microwave energy towards Earth and records the resulting echoes,” he says. “From these signals, we can obtain estimates of the moisture in the soil, because the soil dielectric constant – the electrical properties of the soil – depends strongly on its wetness or dryness.
“Satellite scatterometers were preliminarily intended to measure wind speeds over the ocean, but luckily, ASCAT works at a microwave frequency that also guarantees a high sensitivity to soil moisture.
“While in situ observations are invaluable, the power of satellite data is that they provide observations worldwide in near-real-time.
“This is especially important when looking to predict and respond to extreme weather events such as floods and droughts, which are often preceded by events that happen across large regions, such as continents.
“Another benefit of satellite radar data is their ability to penetrate clouds, rain, and darkness – therefore providing regular, reliable inputs that many applications depend on.
“This includes everything from flood prediction and drought monitoring, to agricultural yield modelling, climate studies, and numerical weather predictions.
“'These applications benefit immensely from EUMETSAT H SAF’s near-real-time soil moisture data services, which launched in 2009 and provide global soil moisture observations within 130 minutes after sensing.”

Credit: EUMETSAT H SAF
Future focus
However, once soil moisture data have been obtained from the microwave signal, there are still substantial challenges.
“It’s not simply a case of taking data and feeding it into models,” Wagner says. “We need to account for limitations such as the resolution of the observations and to provide these data in a way that is accessible and timely for a wide range of users.
“Another issue is that there are still a lot of areas where it is very hard to obtain accurate soil moisture data – for instance in mountainous and heavily forested regions, or in desert regions.
“While soil moisture does not fluctuate quite as dramatically as rainfall, it is still a highly dynamic variable. Experts are still learning how to relate signals in the data to impacts on the ground.
“For example, deviations from the average may mean one thing for relatively dry countries such as Kenya and another thing entirely for relatively wet countries such as India or western Europe.
“And within these different contexts, what do lower or higher than average soil moisture levels mean for vegetation growth in the long term? How does drought in spring affect the probability of extreme weather events in summer? Can we find clear relationships between soil saturation levels, rainfall, and flash floods?”
Answering these questions also presents exciting opportunities, Wagner says.
“We can identify what soil moisture readings in spring might mean for crop harvests in summer, to develop more timely drought and flood warnings, to use the data to infer other measurements such as rainfall, or even imagine entirely new applications,” he says.
“The dawn of next-generation satellite programmes such as the EUMETSAT Polar System – Second Generation (EPS-SG) will expand our technical capacities, whilst also enriching datasets with more observations.
“ASCAT has provided a flavour of what is possible: the scatterometer on board Metop Second Generation satellites will improve the spatial resolution of soil moisture measurements by a factor of two – it will be a fantastic instrument that will radically increase our ability to observe key aspects of the Earth’s water cycle.
“Combining these observations with bounties of data collected by other satellite missions and in situ measurements will enable better observations of global soil moisture fluctuations.
“Assimilating these datasets with other meteorological observations will enhance applications relating to floods, crop growth, numerical weather forecasts, nowcasts, and much more.
“Science rarely follows a defined path. To really integrate the data and come up with answers that are of benefit to society, this interdisciplinary work requires collaboration with experts spanning social scientists, water managers, modelers, machine learning experts, programmers, and many others.

Credit: UNDP/ Rida Amjad
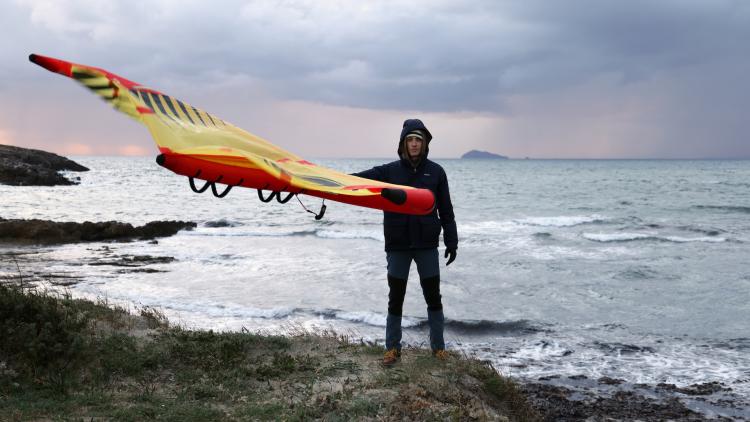
There are a range of factors impacting community vulnerabilities to extreme weather events, including demographic changes, human impacts on the landscape, and climate change, which studies show likely worsened the Pakistan floods – a reality we are now seeing in many parts of the world.
“It’s therefore critical that we do everything we can to make the most of remote sensing data that can help authorities to predict, prepare, and respond to these threats.”
Author:
Adam Gristwood
Main image
Credit: UNDP/ Jamil Akhtar