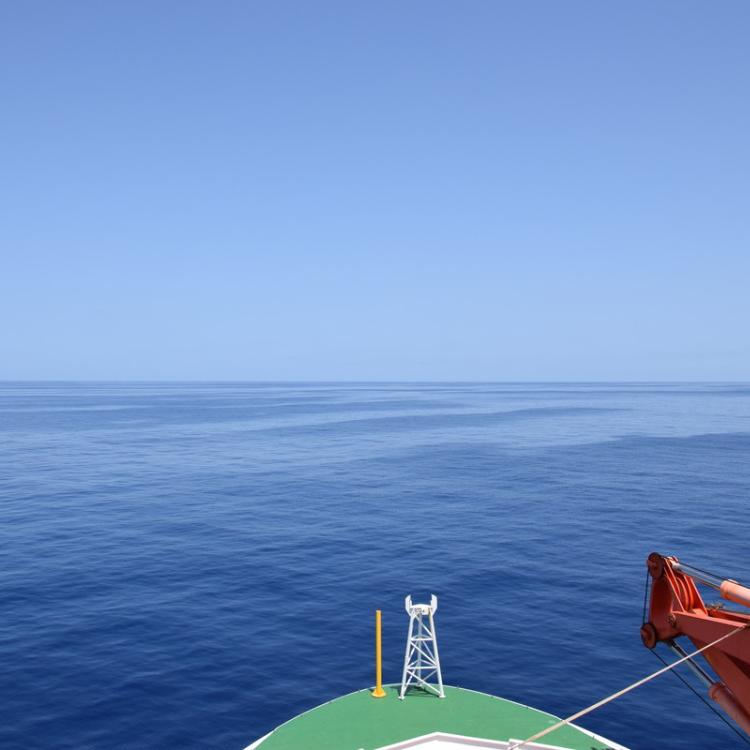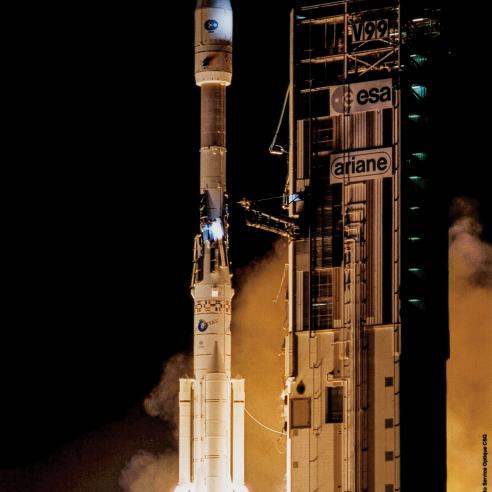


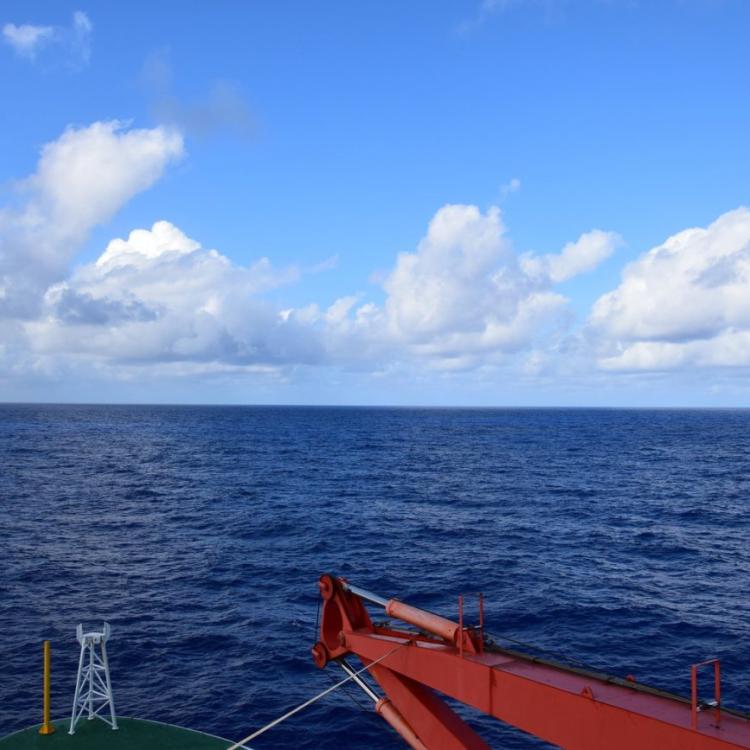
RV Polarstern, tropical South Atlantic, 03 April 2017
Life on the RV Polarstern explained.

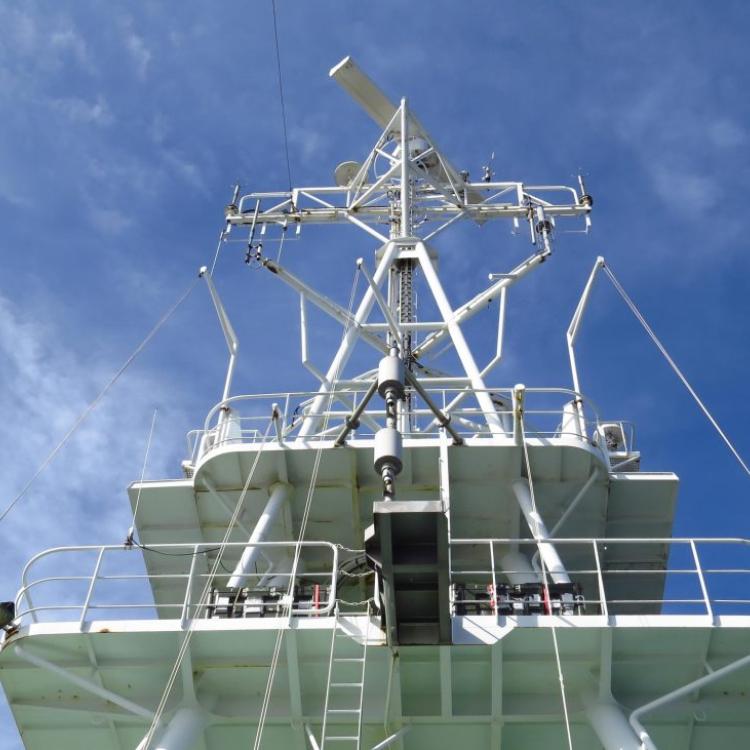
The scatterometer explained.

20 January 2021
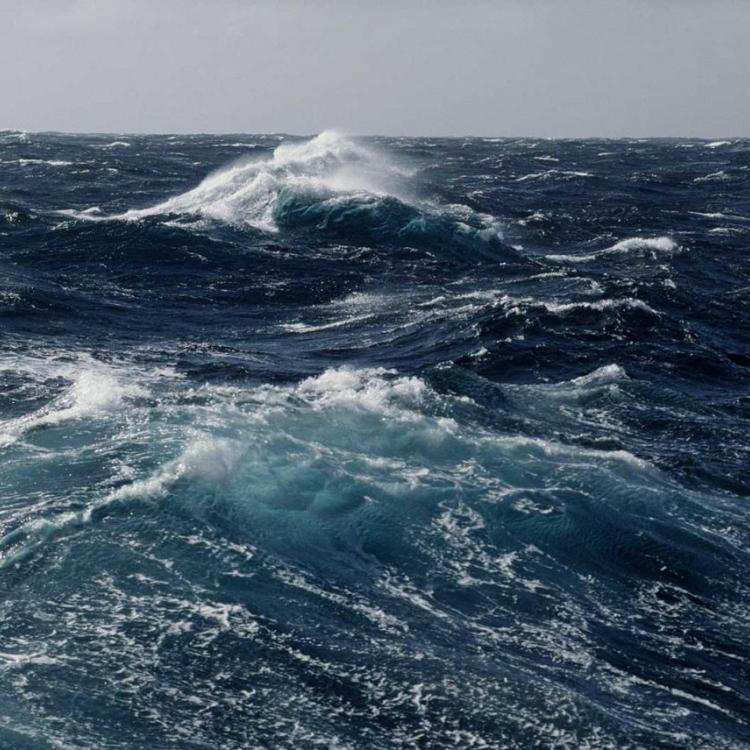
11 April 2017
It's an active instrument that sends down pulses of modulated microwave radiation. These pulses are modified on the ocean surface depending on the wind speed, and the polarized backscatter signal is detected by the instruments' antennas in two strips of 500km width each, located left and right of the flight path – at least these are the values of the ASCAT instruments flying on the European Metop satellites.
The set of three antennas on ASCAT take three measurements of each point on the surface from different directions, and the set of spectra can be translated to an unambiguous value of wind speed and direction.

On Monday morning, we found a nice example how useful these data can be, especially for monitoring the quality of the models. The last days showed a low that came from the north towards the Azores where it was analysed last night (image 1) with about 1010 hPa, a bit weaker than it was the last days. In the corresponding satellite image (image 2) it is clearly visible in the infrared channel, and also the visible image at about 08:00 UTC that was received on board shows the centre located well over the Azores (image 3).


However, the analysis shows a second low, also with about 1010 hPa, and close, north-east of Madeira. We know that this low must have dropped off the low over Morocco due to our knowledge of the last days, and the analysis of the European Centre for Medium-Range Weather Forecasts (ECMWF) for the same time saw them still connected. But when comparing the analysis with the satellite image, at least the location of the cold front is, well, a point for possible discussions. And once you start to doubt the quality of an analysis, it is possible to doubt that the low is real, especially because in the satellite images there is no real sign for its existence, and with only two observations in the area.

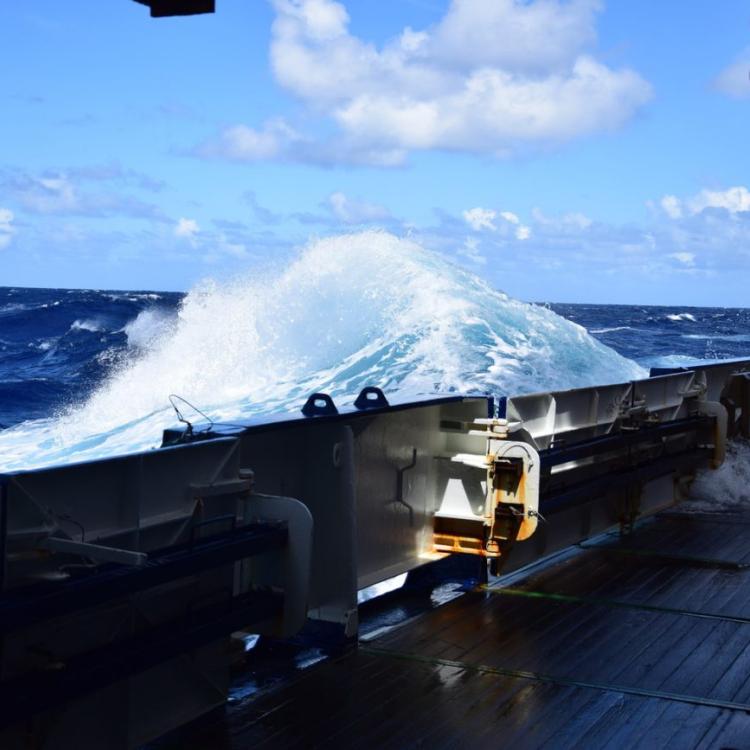
The ASCAT data gives the chance to get a dense field of observations. Image 4 shows the wind field obtained from two ASCAT passes in the three hours before analysis time. The lines represent the starting field of the ECMWF forecast (surface pressure): the white line is the 1015 hPa isobar, red lines are lower, blue lines are higher pressure. The low pressure system fits perfectly in the wind field, and any doubt that the forecast started with the correct pressure field vanished. Our advantage: the lows reduce the pressure gradients and block the usual north-eastern trade wind, making the sea nice flat for the moment (image 4).

Especially in areas of weak pressure gradients the data give good information about local variations in the wind field. Image 6 shows the data of an overpass between 1000 and 1100 UTC on Sunday over the Canary Islands, and you see the variation in the wind directions around the islands. This information found its way in Tobias' forecast which says: “Forecast until Tuesday morning: Northwest 2 to 3, temporarily from varying directions, good visibility; wind sea less than 0.5m, Swell 1 to 1.5 m from Northwest:”

A comparison between ASCAT data and ship measurements show a good agreement with both. In Image 6 you see the corresponding observation of Polarstern at the left edge of the swath, on latitude 23N inside the square. The direction fits well (as always during the journey), but wind speed that is measured on the vessel is higher than the ASCAT value: while our measurement says 14 knots, the expectation from the satellite was only 12 knots. The reason is the measurement height: the wind sensor is fixed in an altitude of 40m on the vessel.
Reducing the measured value to 10m with the usual assumptions for the wind profile gives also 12 knots. This is a point that must be communicated to the customers again and again: wind forecasts are made for 10m altitude, and most measurements will be made in higher altitudes.
More about the ASCAT Webcast on EUMeTrain about ASCAT.