
An ocean of data in action
Join scientists and engineers at EUMETSAT for a weekend hackathon.


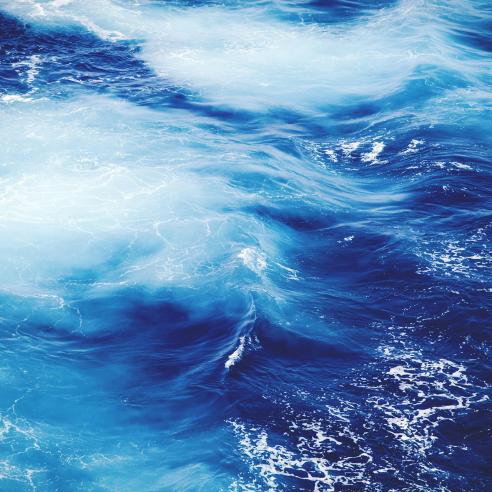
Explore ocean data - without getting your feet wet - on 9-11 June 2017.
20 January 2021
01 June 2017
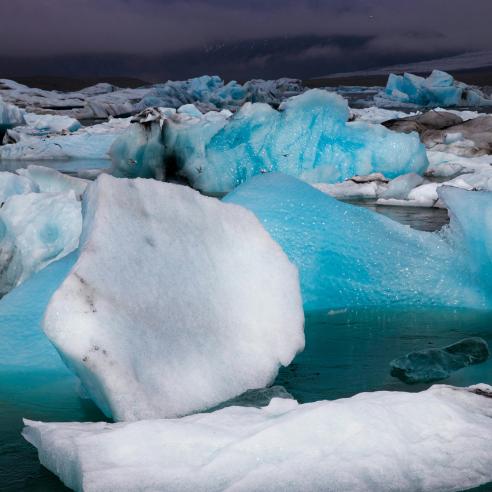
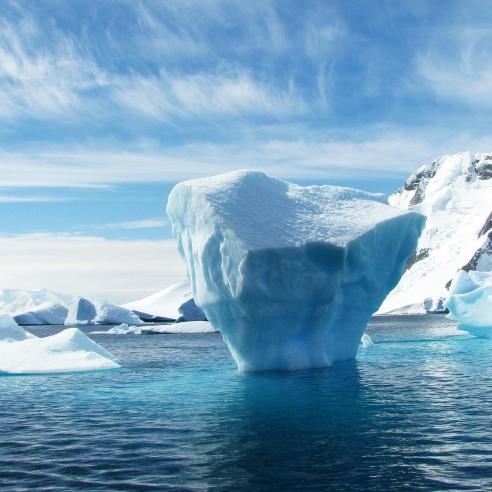
Keeping a constant check on the health of the oceans, Earth observation satellites record global sea surface temperature, wave height, sea level rise, ocean winds, sea ice and even ocean colour.
These data are then used for ocean monitoring and forecasting, weather forecasting (land and marine), management of marine ecosystems, monitoring of water quality and pollution, sea ice charting services and ship routing, and climate monitoring. As part of its activities for the EU’s Copernicus Earth observation and monitoring programme, EUMETSAT is delivering huge quantities of marine data to users from the ocean-monitoring Sentinel-3 and Jason-2 and -3 satellites, and its fleet of weather satellites.
These data are all free and available online. Come to EUMETSAT, learn more about ocean data and do some amazing things with it. The hackathon is organised in partnership with DataViz RheinMain, a group of data “fans” based in Frankfurt, specialised in meetups, hackathons and TEDx events. Register with DataViz to take part in the hackathon here.

DataViz Hackathon challenges - what can you do with Copernicus marine data?
Here are some examples to spark your creativity:
Challenge 1
USEFUL
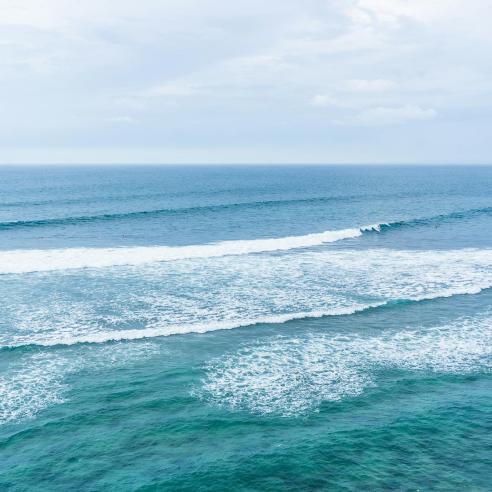
Take Copernicus marine data and use it for something useful – for example can you use sea surface temperature data to help people to make decisions about swimming, use ocean colour data to predict harmful algal blooms, use wave height data to build an app for surfers/seafarers, or combine Earth observation data with data from other sources?
Challenge 2
BEAUTIFUL / STUNNING / EDUCATIONAL
Take the data and visualise it in new and creative ways - perhaps even in augmented reality systems e.g., Meteo AR. Can you use the data to inspire a classroom to learn about the marine environment?
Challenge 3
OPEN
Use our APIs and make it easier for people to access data – for example build an interface to Sentinel-3 data in QGIS to help people use the data. Build a python or R library to access and manipulate the data. Make a Jupyter notebook to help people explore the data.

Organiser of the hackathon, Wolfgang Weicht from DataViz RheinMain, said, “The great thing about hackathons is that you can use data as an introduction to scientific topics. “They demonstrate the educational potential of open data and provide for new ways of doing project-driven learning. “This hackathon in particular is very interesting because it involves marine data, which is crucial to understand our climate. “I am very much looking forward to see what participants design as it is a great opportunity to find innovative products and solutions.”