Aspot image

Image of the week: Sea level anomaly 2024


Watching our Earth from space

Aspot image
Aspot image

This week’s image shows sea level anomalies in 2024, as monitored by satellites such as the Copernicus Sentinel-6 and Sentinel-3 series operated by EUMETSAT.

Last Updated

08 May 2026

Published on

07 May 2026

This dynamic data animation illustrates global sea level anomaly data, showing how sea surface height deviated from the long-term average across the world's oceans. 

The visualisation is based on sea surface height data collected by altimetry satellites such as Copernicus Sentinel-6, -3 and Jason-3 and in situ data. 

Watch the footprint of powerful currents, regional variations, and potential climate signals—such as the influence of major ocean oscillations—as they unfolded over 2024. 

Sea level anomaly is a crucial indicator for understanding ocean dynamics and the effects of a warming climate.

Aspot image

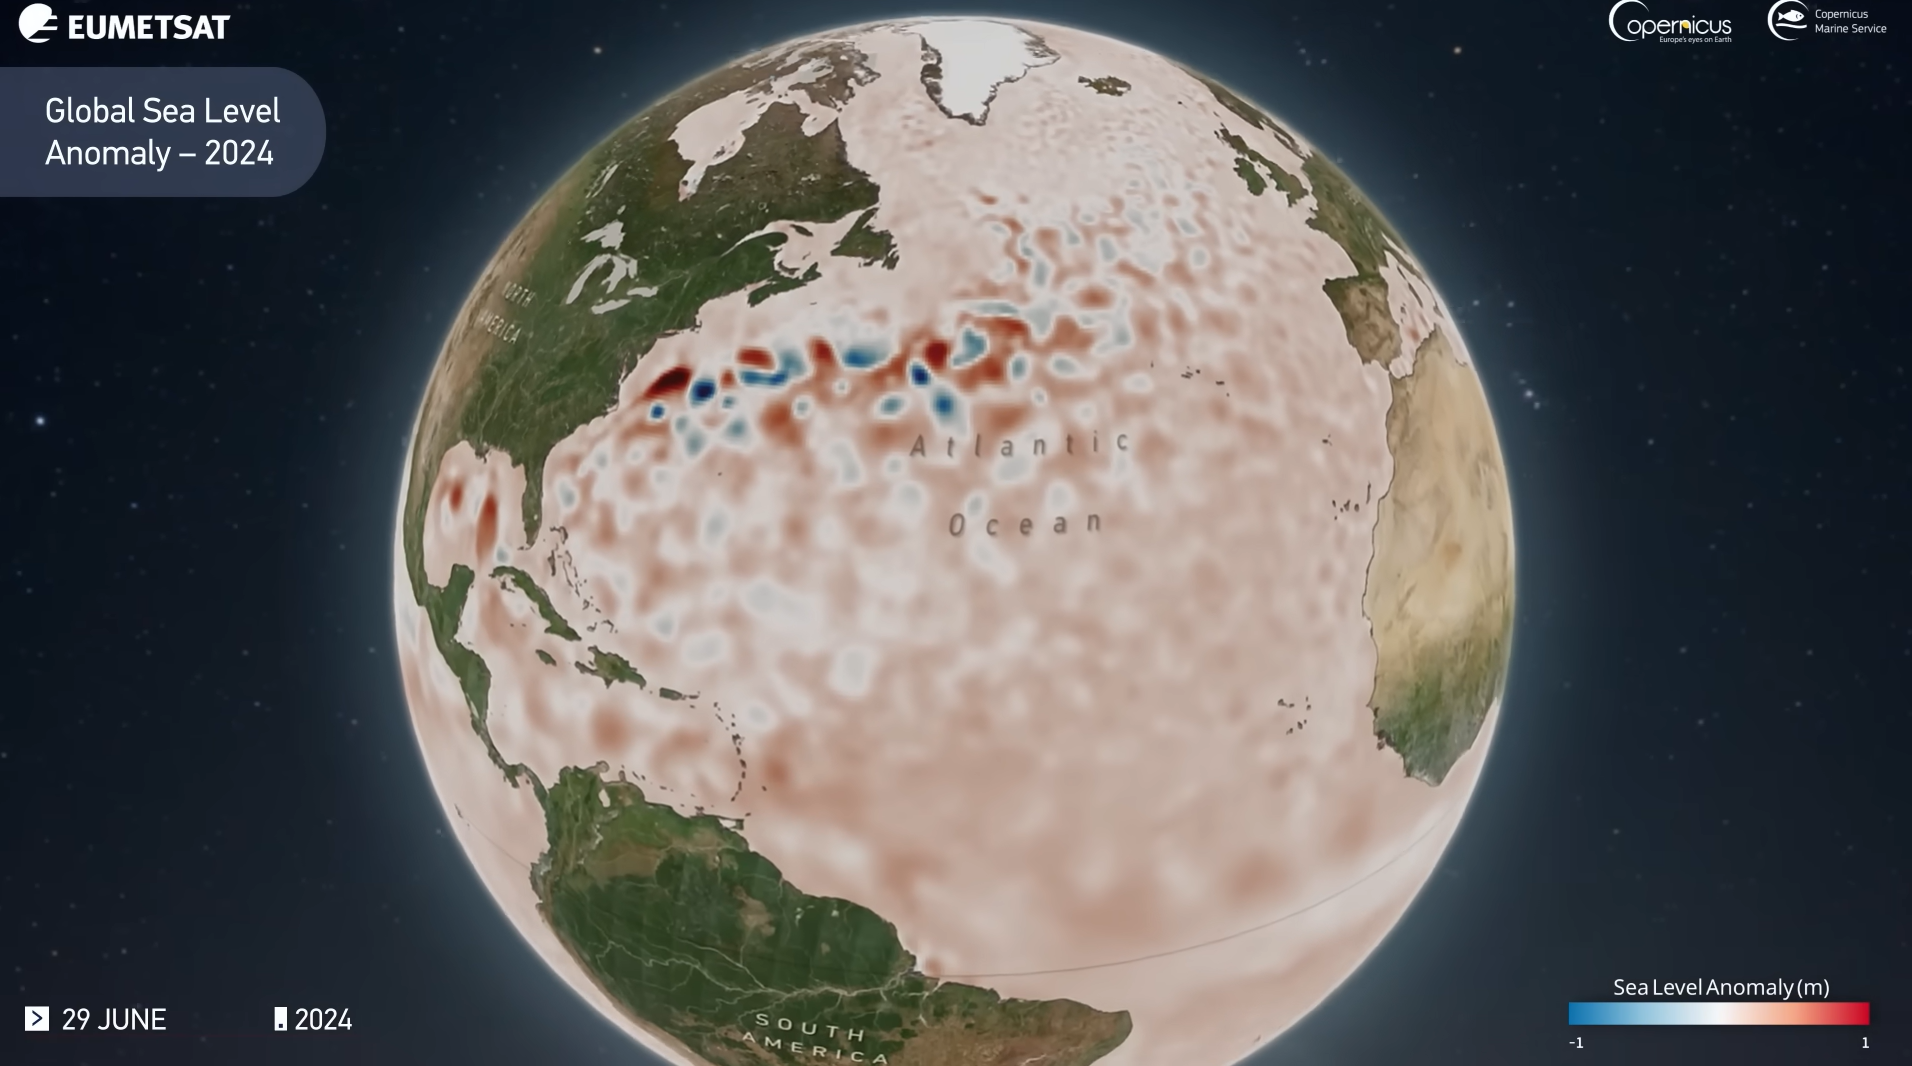
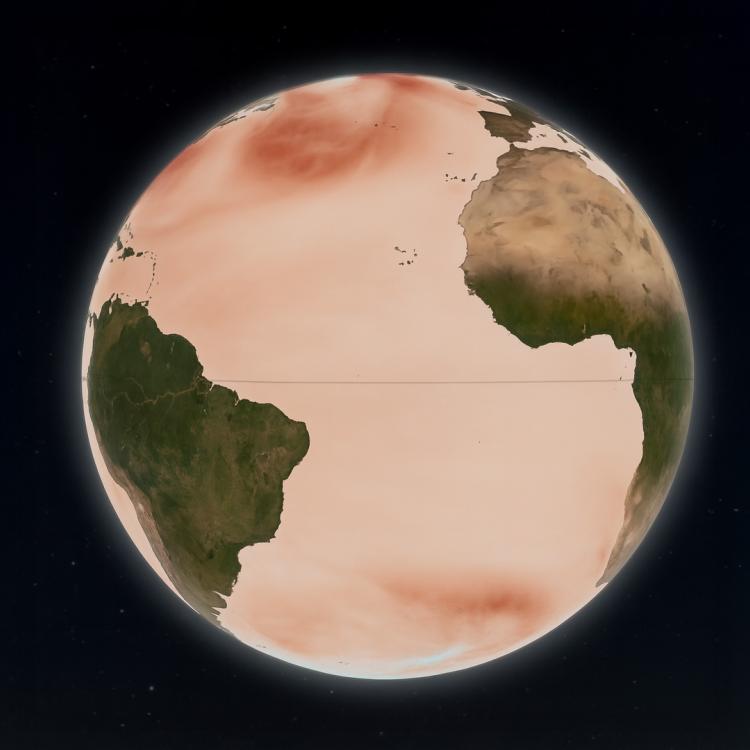
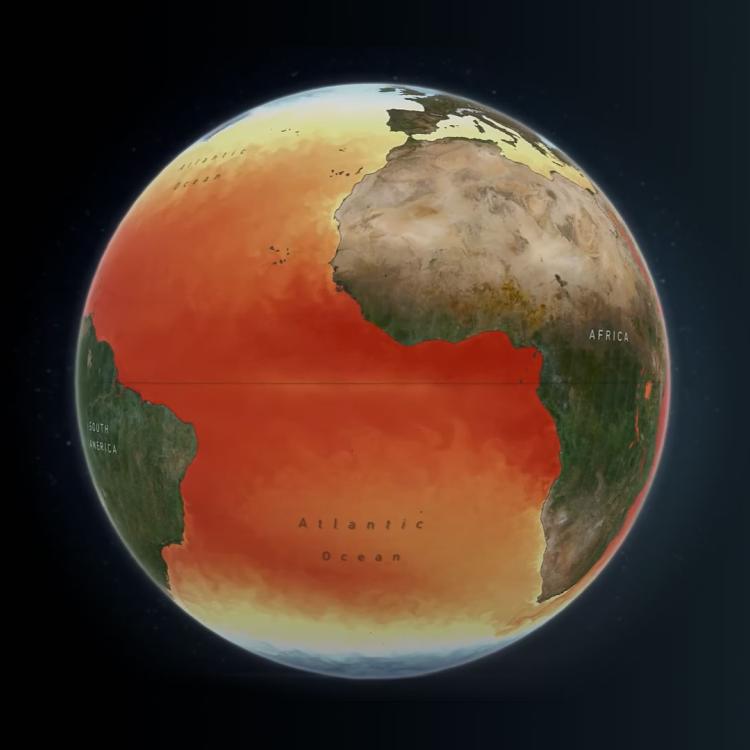
Sea level anomaly image

The image is taken from a visualisation that shows a year of sea level anomaly data around the world in 2024.

In the video, the red colour indicates higher than average sea surface height and blue is less than average.

More info

Find out how EUMETSAT monitors the oceans from space - https://www.eumetsat.int/what-we-monitor/ocean

Copernicus Sentinel-6

Copernicus Sentinel-3 

Access marine data from EUMETSAT: https://user.eumetsat.int/data/themes/marine

Access Copernicus marine data: https://marine.copernicus.eu/