27 January 2023
12 March 2021
Convective storms are the cause of major losses and damages every year, e.g. due to flash floods, massive hailstorms, lightning or fatal wind gusts. They can be very localised events, which numerical models still have difficulties predicting. For more than 40 years, direct atmospheric imagery from broadband imagers on geostationary orbits has been instrumental in the prediction and monitoring of such meteorological events. However, this requires clouds to have already developed.
To enhance the traditional geostationary (cloud) imagery with vertical sounding of the atmospheric temperature and humidity, EUMETSAT is developing a hyperspectral infrared sounder (IRS) to be operated from a geostationary orbit as part of the Meteosat Third Generation (MTG) programme. The IRS will provide a unique look at the atmosphere at unprecedented spatial and temporal sampling. Severe storms are strongly controlled by the atmospheric stability and moisture distribution in the troposphere. Therefore, it is expected that IRS will help improve the monitoring of pre-convective situations and contribute to improvements in precision, and lead-time in the assessment of potential severe weather.
While there is considerable experience of exploiting hyperspectral sounders (like IASI, AIRS and CrIS) data in numerical weather prediction (NWP) and other applications, like atmospheric composition or environmental monitoring, there is no operational heritage in Europe for Nowcasting. Two studies were recently procured to explore the practical aspects of using hyperspectral sounding products, in addition to the data sources commonly utilised by the forecasters. This study was conducted by Hungarian Meteorological Services (OMSZ). Another related study was performed by the European Severe Storm Laboratory (ESSL) — Hyperspectral sounding for severe storm forecasting, testbeds and studies.
This study was a follow-up. The former study evaluated combined infrared (IASI) and microwave (AMSU and MHS) temperature and humidity profile products from the regional service EARS-IASI L2. Since May 2018, these products are routinely ingested in the Hungarian Advanced Workstation (HAWK). In this study, the products were generated with the same statistical algorithm, but only exploiting IASI measurements (IR-only mode), to serve as closer proxy to MTG-IRS.
Objectives
Building on the results and conclusions in the initial study, the objectives of the present work were to:
- Analyse and characterise the consistency between IASI instability products in infrared-only and SEVIRI/GII, NWP forecasts.
- Stratify the above with the IASI L2 quality indicators and assess their relevance for the detection of instabilities.
- Create a database of and analyse the situations where IASI L2 profiles and numerical weather predictions depart significantly from each other.
- Evaluate the feasibility and the potential of using surface air measurements together with satellite products for Nowcasting.
Overview
The study was organised into four main tasks:
- Quantitative intercomparison of the instability indices from IASI against SEVIRI/GII products.
- Conduct case studies.
- Create an inventory of situations where NWP forecasts and IASI L2 products significantly depart from each other.
- Explore the synergistic use of ground-based observations with satellite sounding products.
Quantitative intercomparison of the instability indices
The following diagnostic parameters computed from IR-only retrievals have been compared to the SEVIRI/GII (Global Instability Index) for a six-month period, covering various geographic regions. Good correspondence between IASI L2 IR-only, MW and IR and the GII products were found. Larger differences were observed in cloudy cases with IR-only products, as expected.
- Total Precipitable Water (TPW)
- Mean relative humidity in the lowest 0-3 km width layer (0-3km RH)
- K-index
- Best lifted index
- Maximum Buoyancy
- MLCAPE
- 400/700 hPa lapse rate
- 600/925 hPa lapse rate
Single profile inspections
The IR-only and MW and IR profiles have been inspected individually in a number of different meteorological situations, to evaluate the representativeness and possible loss of accuracy in the IR-only mode, e.g. in clouds, as compared to the combined MW and IR retrievals.
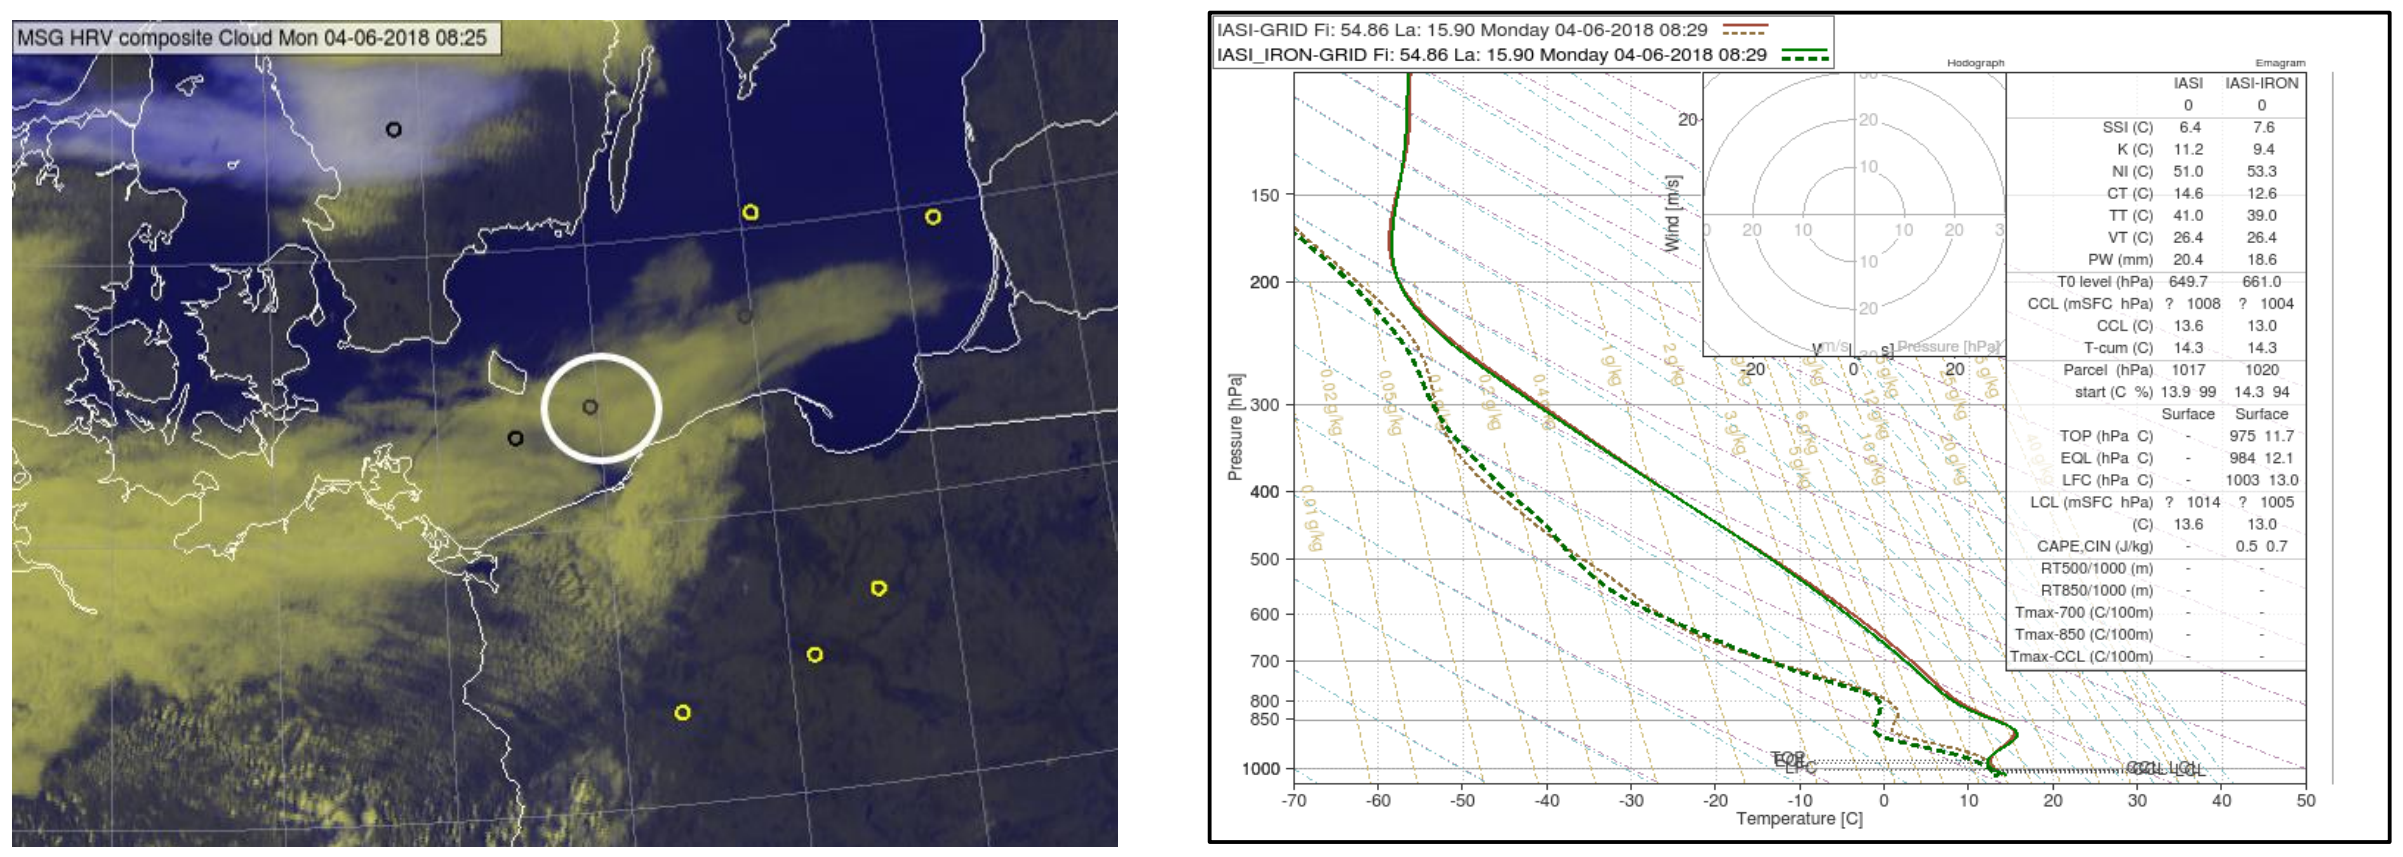
Blending surface and satellite observations
The temperature and humidity conditions near surface are essential parameters controlling the atmospheric stability. However, hyperspectral sounders are by nature less sensitive in the boundary layer. This results sometimes in underestimating the Convective Available Potential Energy (CAPE) with satellite sounders. In order to combine the best knowledge of the surface air parcels and troposphere, the study has explored the synergistic use of ground observations from operational weather stations together with satellite sounding. The objective was to evaluate the potential as well as the practical aspects of the methodology, in view of possible routine application. The experience confirmed that higher values of CAPE, indicating more clearly potential instability, are obtained when using ground surface air observations together with satellite sounding. The practical implementation of a routine surface/satellite collocation needs further investigation. Interestingly, higher CAPE quantities could also be calculated when replacing the temperature and humidity of the numerical forecasts by ground observations. In the example below, the combination of IASI and ground observation yield the largest instability, due to a higher lapse rate in the IASI profiles.