27 January 2023
11 March 2021
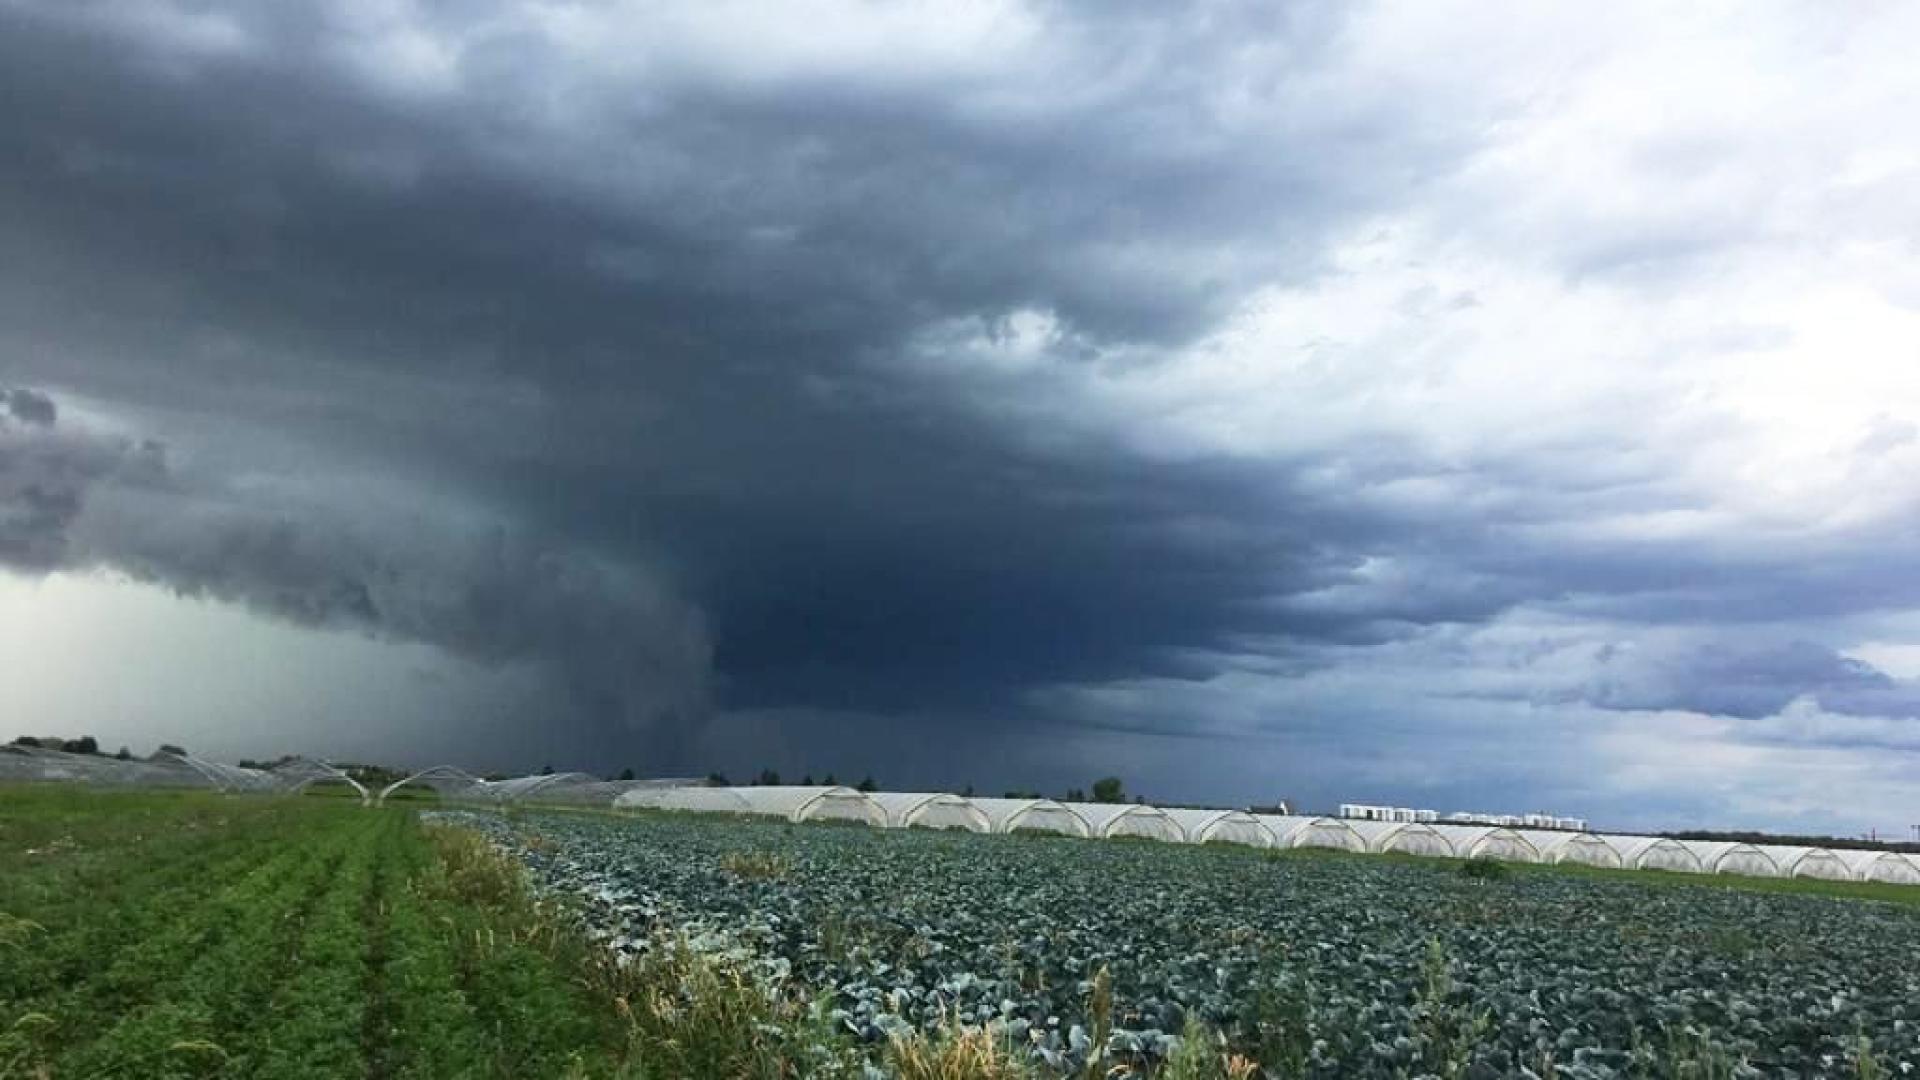
Convective storms are the cause of major losses and damages every year, e.g. due to flash floods, massive hailstorms, lightning or fatal wind gusts. They can be very localised events, which numerical models still have difficulties predicting. For more than 40 years, direct atmospheric imagery from broadband imagers on geostationary orbits has been instrumental in the prediction and monitoring of such meteorological events. However, this requires clouds to have already developed.
To enhance the traditional geostationary (cloud) imagery with vertical sounding of the atmospheric temperature and humidity, EUMETSAT is developing a hyperspectral infrared sounder (IRS) to be operated from a geostationary orbit as part of the Meteosat Third Generation (MTG) programme. The IRS will provide a unique look at the atmosphere at unprecedented spatial and temporal sampling. Severe storms are strongly controlled by the atmospheric stability and moisture distribution in the troposphere. Therefore, it is expected that IRS will help improve the monitoring of pre-convective situations and contribute to improvements in precision, and lead-time in the assessment of potential severe weather.
While there is considerable experience of exploiting hyperspectral sounders (like IASI, AIRS and CrIS) data in numerical weather prediction (NWP) and other applications, like atmospheric composition or environmental monitoring, there is no operational heritage in Europe for Nowcasting. Two studies were recently procured to explore the practical aspects of using hyperspectral sounding products in addition to the data sources commonly used by the forecasters.
This study was conducted by the European Severe Storm Laboratory (ESSL). Another related study was performed by the Hungarian Meteorological Services (OMSZ) –link to page for Detection and monitoring of instability from hyperspectral sounders, using IASI in view of MTG-IRS –. In these studies, IASI products from the EUMETSAT Polar System (EPS), from the regional service EARS-IASI L2, have been used as proxy products for IRS.
Objectives
The objectives of this procurement were to:
- Raise User awareness about hyperspectral products properties and contribute to User preparation, especially in view of MTG-IRS.
- Investigate the potential and practical aspects of directly using hyperspectral sounding profiles for severe storm forecasting, in addition to the data sources commonly utilised by the forecasters in Europe.
- Contribute to the consolidation of products requirements in that respect.
Overview
The study was organised into four main tasks:
- Adapt the ESSL weather monitoring system to ingest the EARS-IASI L2 products, including near-real time data as well as selected historical cases of interest.
- Build a catalogue of relevant meteorological situations, for immediate and further case studies with hyperspectral products.
- Conduct a first detailed analysis of a subset of the above situations.
- Organise test-bed activities with forecasters, using IASI products in the ESSL research & training site.
In addition, ESSL provided an introduction training to severe weather forecasting within EUMETSAT. Visualisation of the IASI L2 in the ESSL weather monitoring facility The parameters which can be visualised are listed in the following table
| Parameter | Description |
|---|---|
| Parameter | Description |
| MLCAPE50 | CAPE* for a mixed-layer parcel from the lowest 50 mb above the surface (in J/kg) |
| MLCAPE100 | CAPE for a mixed-layer parcel from the lowest 100 mb above the surface (in J/kg) |
| SBCAPE | CAPE for a parcel lifted from the lowest available model or IASI level (in J/kg) |
| MUCAPE | CAPE for a parcel lifted from the lowest available model or IASI level (in J/kg) |
| MLCIN50 | CIN for a mixed-layer parcel from the lowest 50 mb above the surface (in J/kg) |
| SFC mixr | mixing ratio at the lowest available model or IASI level (in g/kg) |
| ML50 mixr | mixing ratio for a mixed-layer parcel from the lowest 50 mb above the surface (in g/kg) |
| ML100 mixr | mixing ratio for a mixed-layer parcel from the lowest 100 mb above the surface (in g/kg) |
| Total Precipitable Water | vertically integrated water content (in mm) |
| SFC-500 mb lapse rate | vertical temperature gradient between the lowest available model or IASI level and the 500 mb level (in 10-3 K/m, or K/km) |
| 850-500 mb lapse rate | vertical temperature gradient between the 850 and the 500 mb level (in 10-3 K/m, or K/km) |
| MLLI50 | Lifted Index for a mixed-layer parcel from the lowest 50 mb above the surface (in K, or °C) |
* CAPE : Convective Available Potential Energy
Test bed
The ESSL Testbed 2019 took place in June and July 2019, at the ESSL Research and Training Centre in Wiener Neustadt. Forty-one forecasters from 14 different countries participated (Austria, Germany, the Netherlands, Slovakia, Croatia, Portugal, Latvia, Bulgaria, Italy, Czechia, Poland, Cyprus, Slovenia, and the UK). The Testbed week of 15–19 July 2019 was a special 'Expert week' reserved for participants who had already attended Testbed or ESSL courses before, in order to focus on the product evaluation. The outcomes of the interactions with the forecasters were also communicated at the European Meteorological Society conference 2019 (see poster).

Case studies
Out of 40 meteorological situations of interest forming the catalogue, a first detailed analysis was conducted on the following 10.
| Date | Description | Location |
|---|---|---|
| 1 Aug 2017 | Convective initiation failure in high CAPE and high shear setup | Germany |
| 11 Aug 2017 | Destructive convective windstorm | Western Poland |
| 17 Sep 2017 | Damaging convective windstorm in low CAPE environment | Northern Balkans |
| 13 Jun 2018 | Damaging hailstorm. Low storm activity further north | Serbia, Hungary |
| 26 Jan 2019 | Strong tornadoes | South Turkey |
| 5 Jun 2019 | Severe wind gusts with elevated CAPE | Netherlands, Belgium |
| 11 Jun 2019 | Giant hail | Slovenia, Croatia |
| 10 Jul 2019 | Extremely severe storms | Italy and Greece |
| 9 Aug 2019 | Severe storms with tornadoes and hail | Luxembourg, France, Netherlands |
| 11–12 Sep 2019 | Deadly flash floods | Spain |
Summary outcome
- Large positive consensus about the potential of such products to support the work of the forecasters, with some encouraging results from practical case studies.
- The retrievals should stay independent from model forecast data, in order to provide complementary information (all be it at lower vertical resolution).
- Preferred parameters: CAPE, lapse rate and precipitable water-vapour (layer and columns).
- Lower sensitivity/precision near surface for humidity observed with IASI products in some instance. To be analysed if further improvements are possible or if synergy with ground observation should be considered.
- The provision of uncertainty profiles in addition to the retrievals are required to identify the most reliable levels (currently a scalar quality indicator is supplied).
- Two passes/day with the Polar satellite is a limiting factor for instability monitoring. Higher spatial and temporal resolution would enable the direct monitoring of atmospheric patterns (as will be permitted with MTG-IRS).


